Learn Why Social Data is the Missing Layer in Crypto Research
Most crypto research stops at price and volume. That's like reading a book by only looking at the page numbers.
If you've ever been caught off guard by a token pumping 40% overnight with no obvious catalyst, or watched a coin bleed for weeks despite strong fundamentals, you've experienced what happens when you're missing the social layer.
Price tells you what happened. Volume tells you how much conviction was behind it. But neither tells you why. Social intelligence fills that gap.
The Third Pillar of Market Research
Traditional market analysis relies on two pillars: technical analysis (price patterns, indicators, support/resistance) and fundamental analysis (revenue, tokenomics, developer activity, partnerships). Both matter. Neither is sufficient.
Here's the problem: markets are driven by humans. Humans talk before they trade. They post on X, debate on Reddit, create YouTube breakdowns, share TikTok takes, and write news articles. This social activity generates measurable signals that precede and explain price movement.
Social intelligence is the systematic collection, analysis, and interpretation of these signals across every major platform.
LunarCrush processes social data from X, Reddit, YouTube, TikTok, Instagram, and news sources for every cryptocurrency, stock, and topic in real time. That means millions of posts per day, distilled into actionable metrics that reveal what the market is thinking before it acts.
What Social Intelligence Actually Measures
Social intelligence isn't just "how many times was Bitcoin mentioned today." It's a multi-dimensional framework that captures the full picture of public market discourse. Here are the core metrics that matter:
Engagements measure the total interactions (likes, comments, shares, retweets) generated by posts mentioning a given asset. This reveals how much the market actually cares about what's being said, not just how much is being said.
Mentions track the raw count of social posts referencing an asset across all platforms. A spike in mentions often signals that something is breaking, whether it's news, a rumor, or a viral meme.
Creators count the number of unique social accounts posting about an asset. This distinguishes between one influencer spamming 50 tweets and 50 independent people all talking about the same thing. The latter is a much stronger signal.
Sentiment measures the ratio of positive to negative social posts. A coin can have massive mention volume with terrible sentiment (think: a hack or rug pull), or moderate volume with overwhelmingly positive sentiment (think: a major partnership announcement).
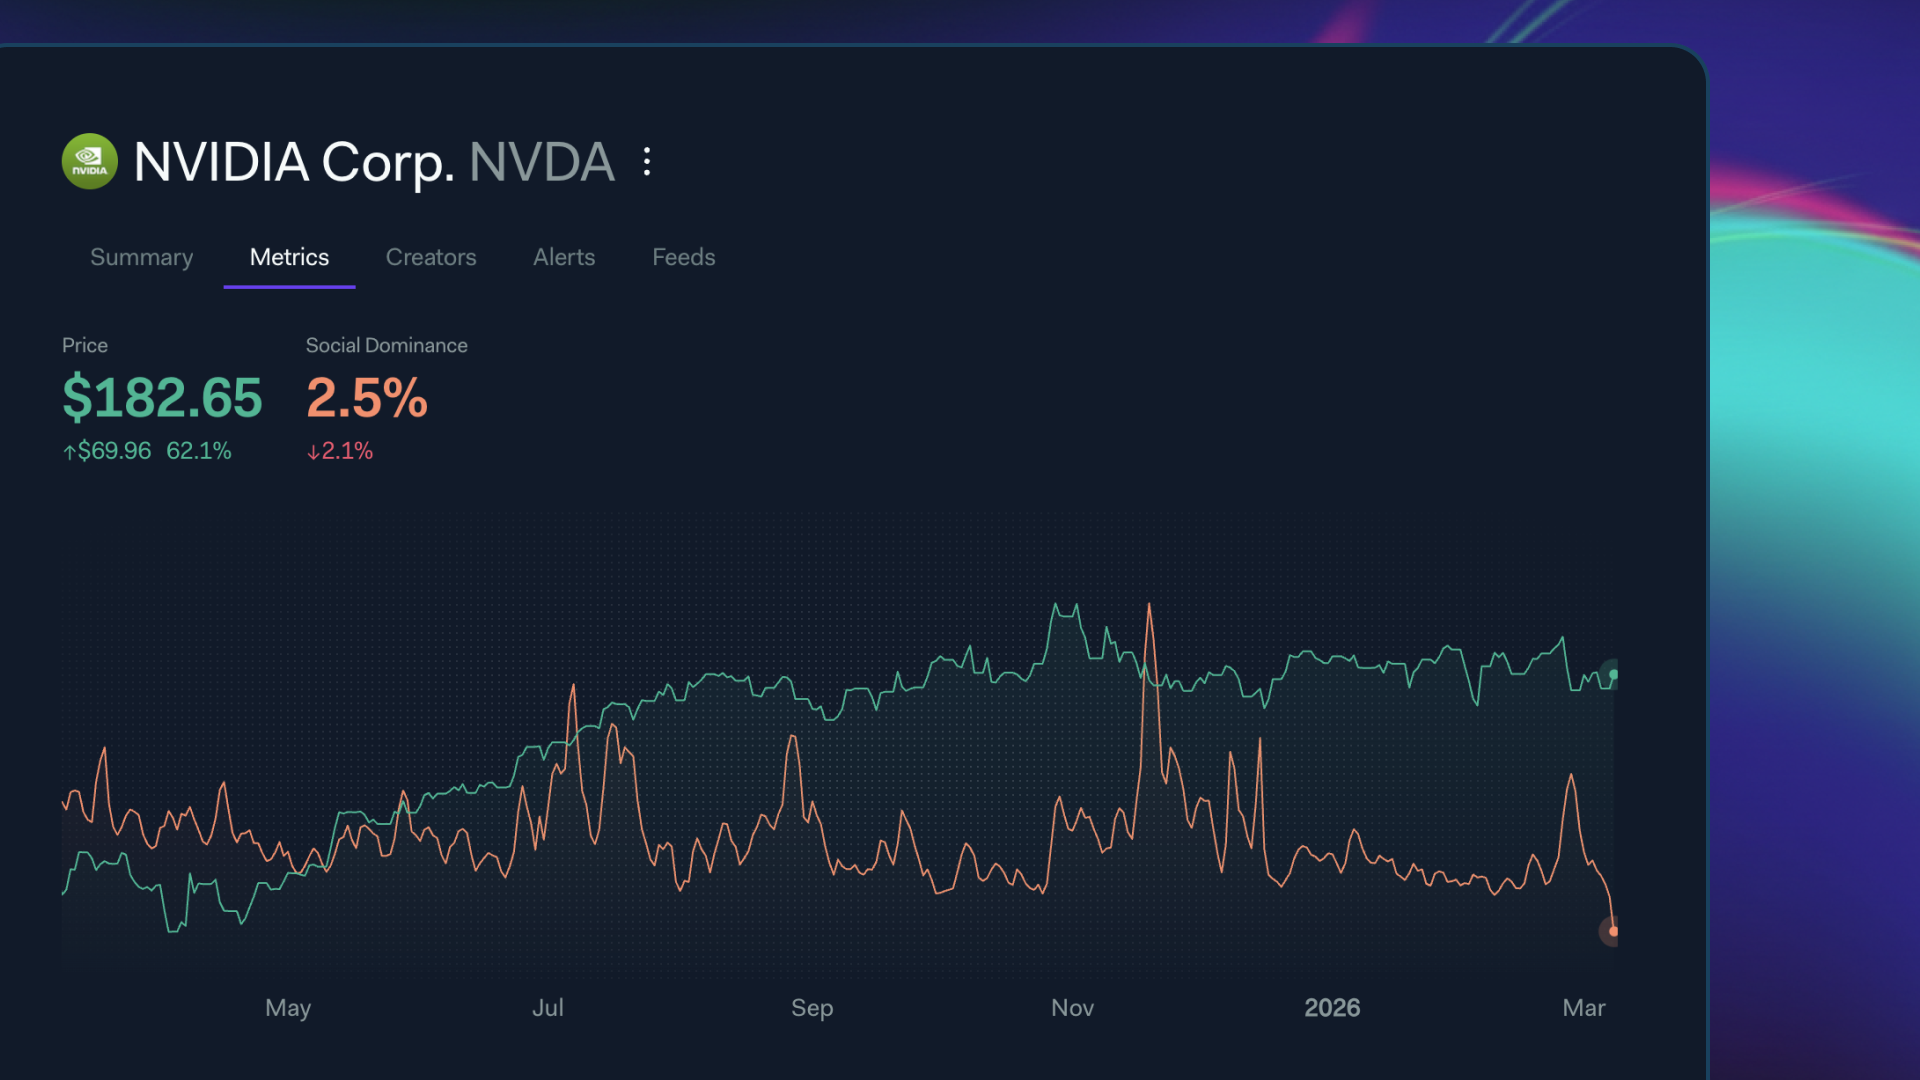
Social Dominance shows what percentage of total crypto social activity is focused on a specific asset. When Bitcoin's social dominance spikes, it usually means the broader market is in fear mode and capital is rotating to perceived safety.
Galaxy Score and AltRank: Proprietary Intelligence
Beyond raw social metrics, LunarCrush computes two proprietary scores that synthesize social and market data into single, actionable numbers.
Galaxy Score (0-100) evaluates the overall health of a crypto project by combining social activity, sentiment, engagement quality, and market performance. A Galaxy Score near 80+ generally indicates a project with strong, organic social momentum aligned with positive price action. A score below 30 suggests the project is either being ignored or discussed negatively.
AltRank combines social intelligence with market performance to rank every cryptocurrency against every other. Lower is better. A coin with AltRank #1 has the strongest combined social momentum and price action in the entire market. This metric is particularly useful for identifying coins that are outperforming on both social and market dimensions simultaneously.
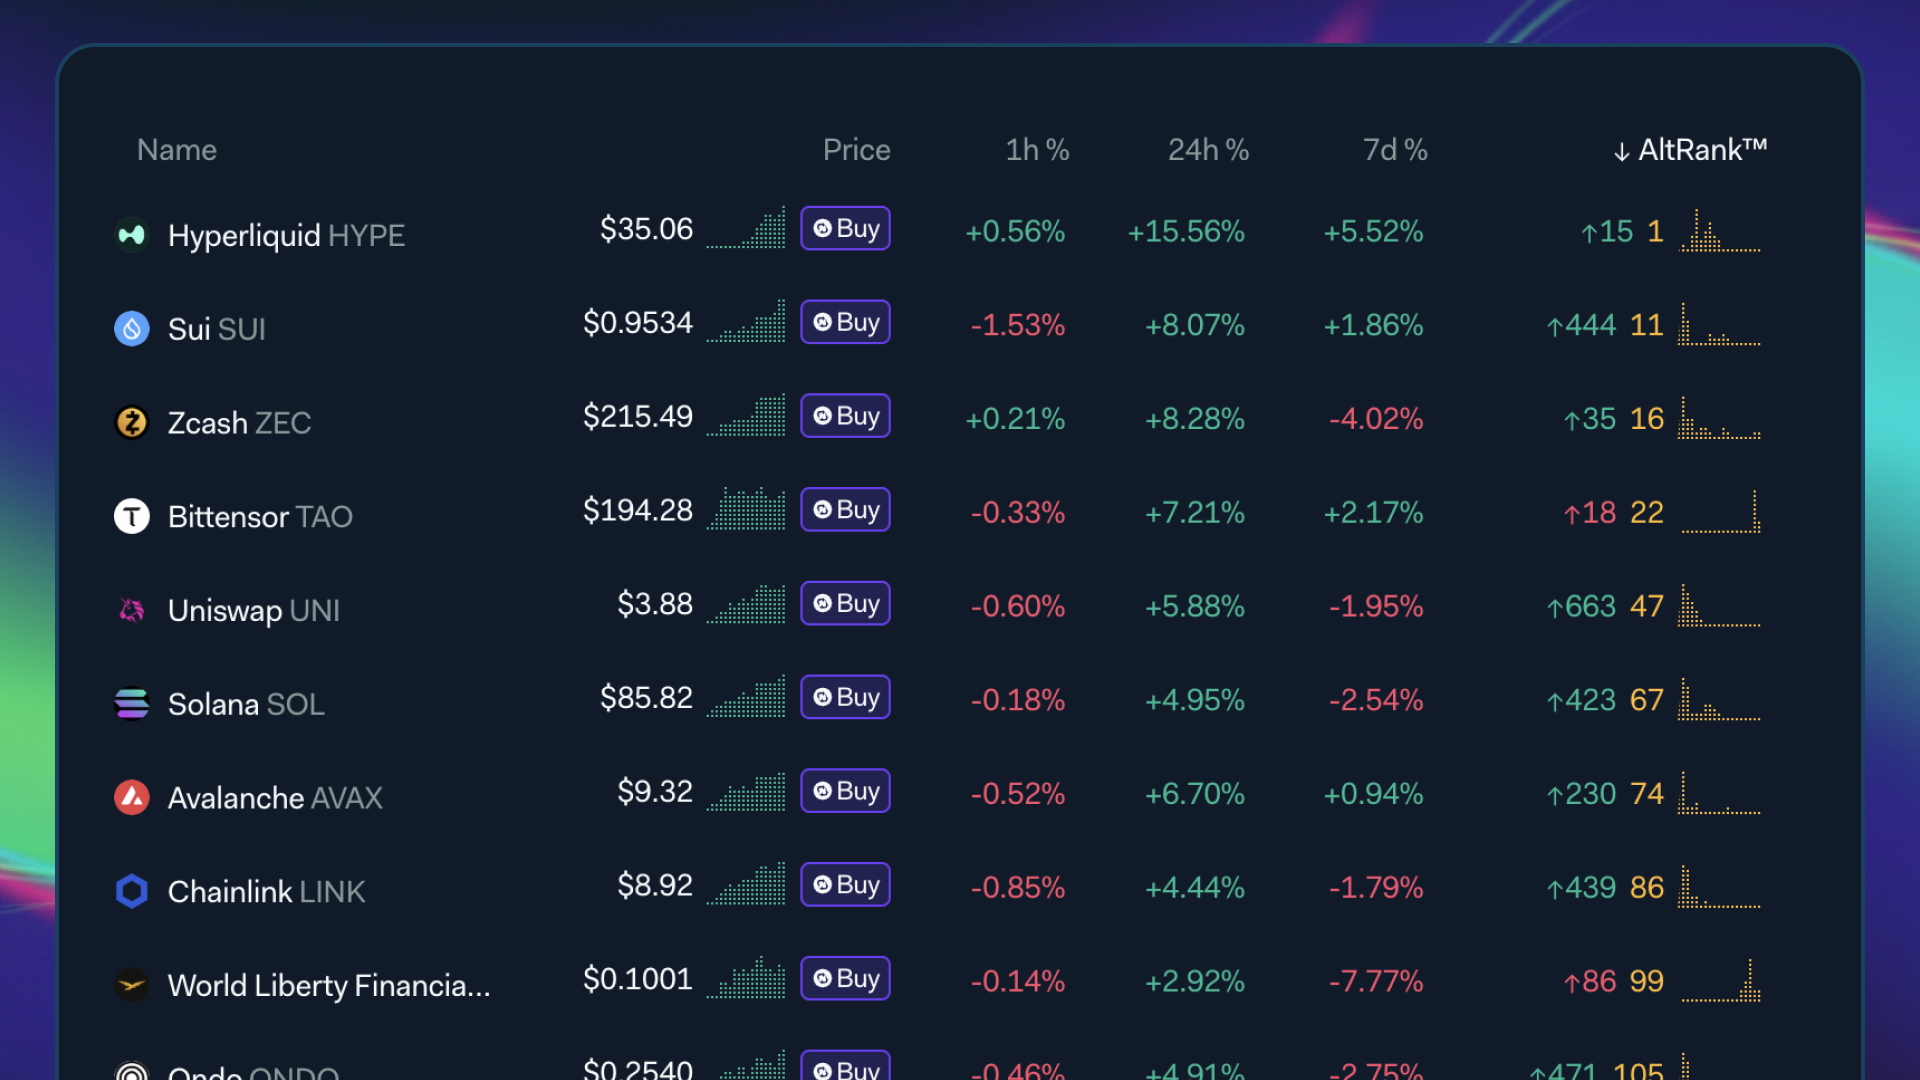
Right now, for example, looking at the top 100 coins by Market Cap, Hyperliqui holds AltRank #1. That tells you which assets have the strongest combined social-plus-market momentum at this exact moment.
A Real Example: Bitcoin's Social-Price Divergence
Here's where social intelligence moves from interesting to essential.
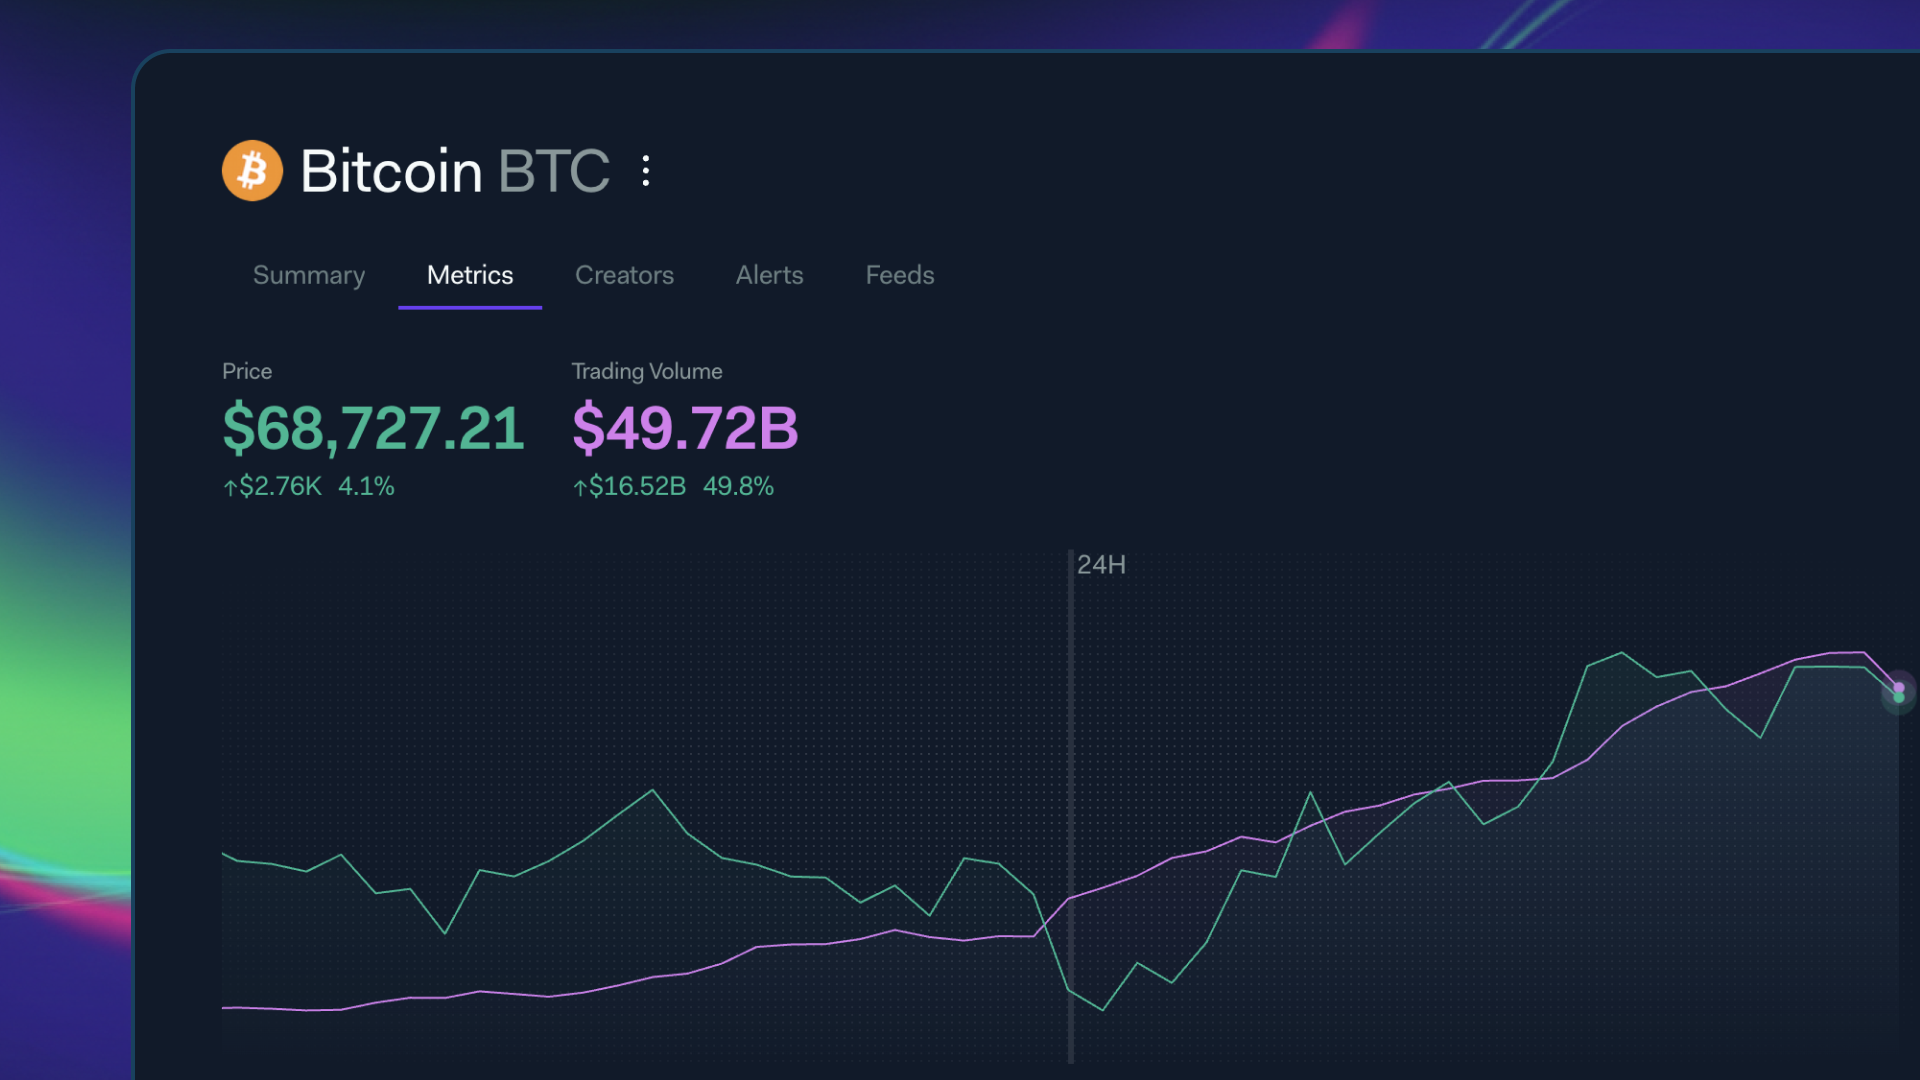
At time of posting, Bitcoin is currently trading at around $68,700. That's roughly 46% below its 1-year high of $125,071 set in October 2025. If you looked only at price, you'd see a coin in a deep correction.
But the social data tells a different story. Bitcoin engagements just hit an all-time record of over 4 billion in a single day. Mentions are at 458,000, which is 157% above the daily average and approaching a 52-week high. Its Galaxy Score sits at 78, near its own 52-week high.
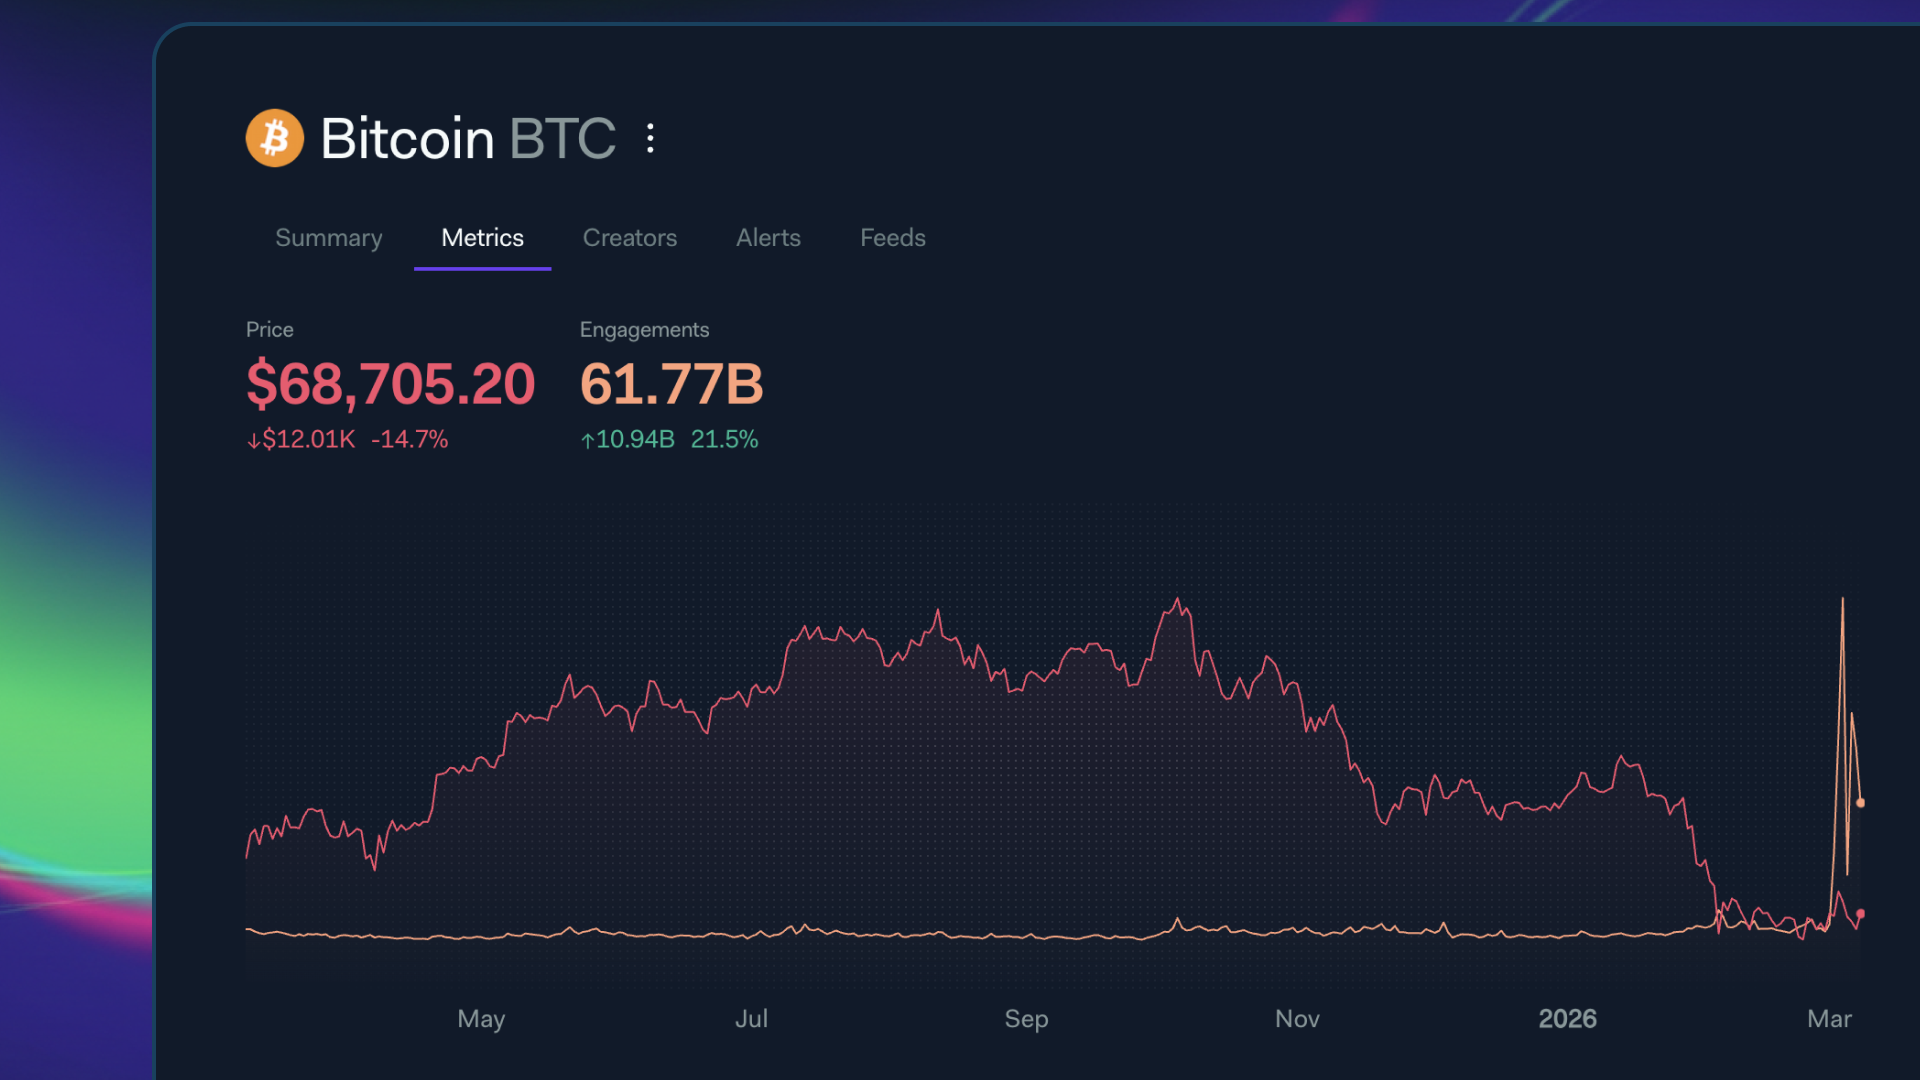
This is a social-price divergence: the market is more engaged with Bitcoin than almost any point in the last year, even though the price is near its lowest. Historically, periods where social engagement dramatically outpaces price have preceded significant moves. The crowd is paying attention. They're debating, analyzing, and positioning. The question for researchers is whether that energy converts into buying pressure or exhaustion.
You can track this divergence yourself on the Bitcoin topic page and compare the engagement chart against the price chart in real time.
Why This Matters for Every Market Participant
Social intelligence isn't just for day traders trying to catch a pump. It serves every type of market participant differently.
For investors, social data provides an early warning system. A project whose Galaxy Score is collapsing while price hasn't yet reacted is worth watching closely. Conversely, a project with quietly rising social momentum and improving sentiment may be accumulating before a breakout.
For developers, social intelligence reveals which narratives and sectors are gaining traction. Right now, the DePIN sector (Decentralized Physical Infrastructure Networks) is generating significant social activity, with projects like Hivemapper and Holo leading Galaxy Score rankings in the category. If you're building in crypto, knowing where attention is flowing helps you decide where to build.
For brands and enterprises, social data maps the competitive landscape. Which exchanges are being discussed most? Which financial firms are capturing retail attention? LunarCrush tracks over 582,000 unique creators posting about stocks daily and over 262,000 posting about crypto. When a competitor's mentions spike 200% overnight or a sector narrative shifts, that signal appears in LunarCrush data in real time, not in a monthly report. (For a deeper look at brand applications, see our post on how brands use social intelligence.)
How to Start Using Social Intelligence Today
LunarCrush makes social intelligence accessible at every level.
Explore for free. The LunarCrush Discover app gives you real-time access to social metrics, rankings, sentiment, and trending topics for thousands of cryptocurrencies and stocks.
Go deeper with AI. The LunarCrush Connector for Claude lets you query social data directly inside Anthropic's Claude AI. Ask questions in natural language like "Which AI-sector tokens have the highest engagement today?" or "Compare the social momentum of Coinbase vs. Robinhood over the last 30 days." The AI combines LunarCrush's real-time data with reasoning to deliver research that used to take hours.
Build with the API. The LunarCrush API gives developers and institutions programmatic access to every metric, time series, and ranking. Build dashboards, alerts, trading signals, or custom research tools on top of the same data that powers the platform.
Custom solutions for enterprises. For funds, exchanges, and brands that need custom term tracking, white-label data, or dedicated support, LunarCrush Enterprise provides tailored solutions.
The Bottom Line
Price and volume are necessary but not sufficient for understanding markets. Social intelligence adds the human layer: what people are saying, how intensely they're saying it, and whether the crowd agrees or disagrees.
In a market where narratives move faster than fundamentals, ignoring social data means flying half-blind. LunarCrush exists to make sure you don't have to.