Here's how LunarCrush social intelligence applies to stocks, ETFs, and the broader financial markets.
When most people hear "LunarCrush," they tend to think cryptocurrency. That's where the platform started, and it's still the deepest dataset in the industry. But the same social intelligence framework that tracks every crypto token also tracks thousands of publicly traded stocks, and the insights are just as sharp.
Social media drives equity markets more than most institutional investors want to admit. Retail traders coordinate on Reddit. Earnings expectations build on X. Product sentiment forms on TikTok and YouTube. News breaks online before it hits Bloomberg terminals. If you're researching stocks without social data, you're missing signals that move prices.
LunarCrush brings the same engagement tracking, sentiment analysis, creator rankings, Galaxy Score, and AltRank metrics to stocks that it applies to crypto. Same methodology. Same real-time data. Same ability to compare, rank, and analyze.
What Social Intelligence Reveals About Stocks
Let's look at two of the most-discussed stocks on the planet right now and what their social data tells us that price charts alone cannot.
NVIDIA ($NVDA): Social Dominance Before Earnings
NVIDIA is currently trading at around $195.60, up 5.36% over the past week. Standard chart reading would tell you the stock is in a recovery trend near its 52-week high of $207.
The social data tells you why and reveals the intensity behind it. NVIDIA just posted 175 million engagements in a single 24-hour period, which is 221% above its daily average. That engagement number recently hit a 52-week high of 134 million. Social mentions are up 25% from the prior month. Creator activity (the number of unique accounts posting about NVIDIA) is up 26% month-over-month.
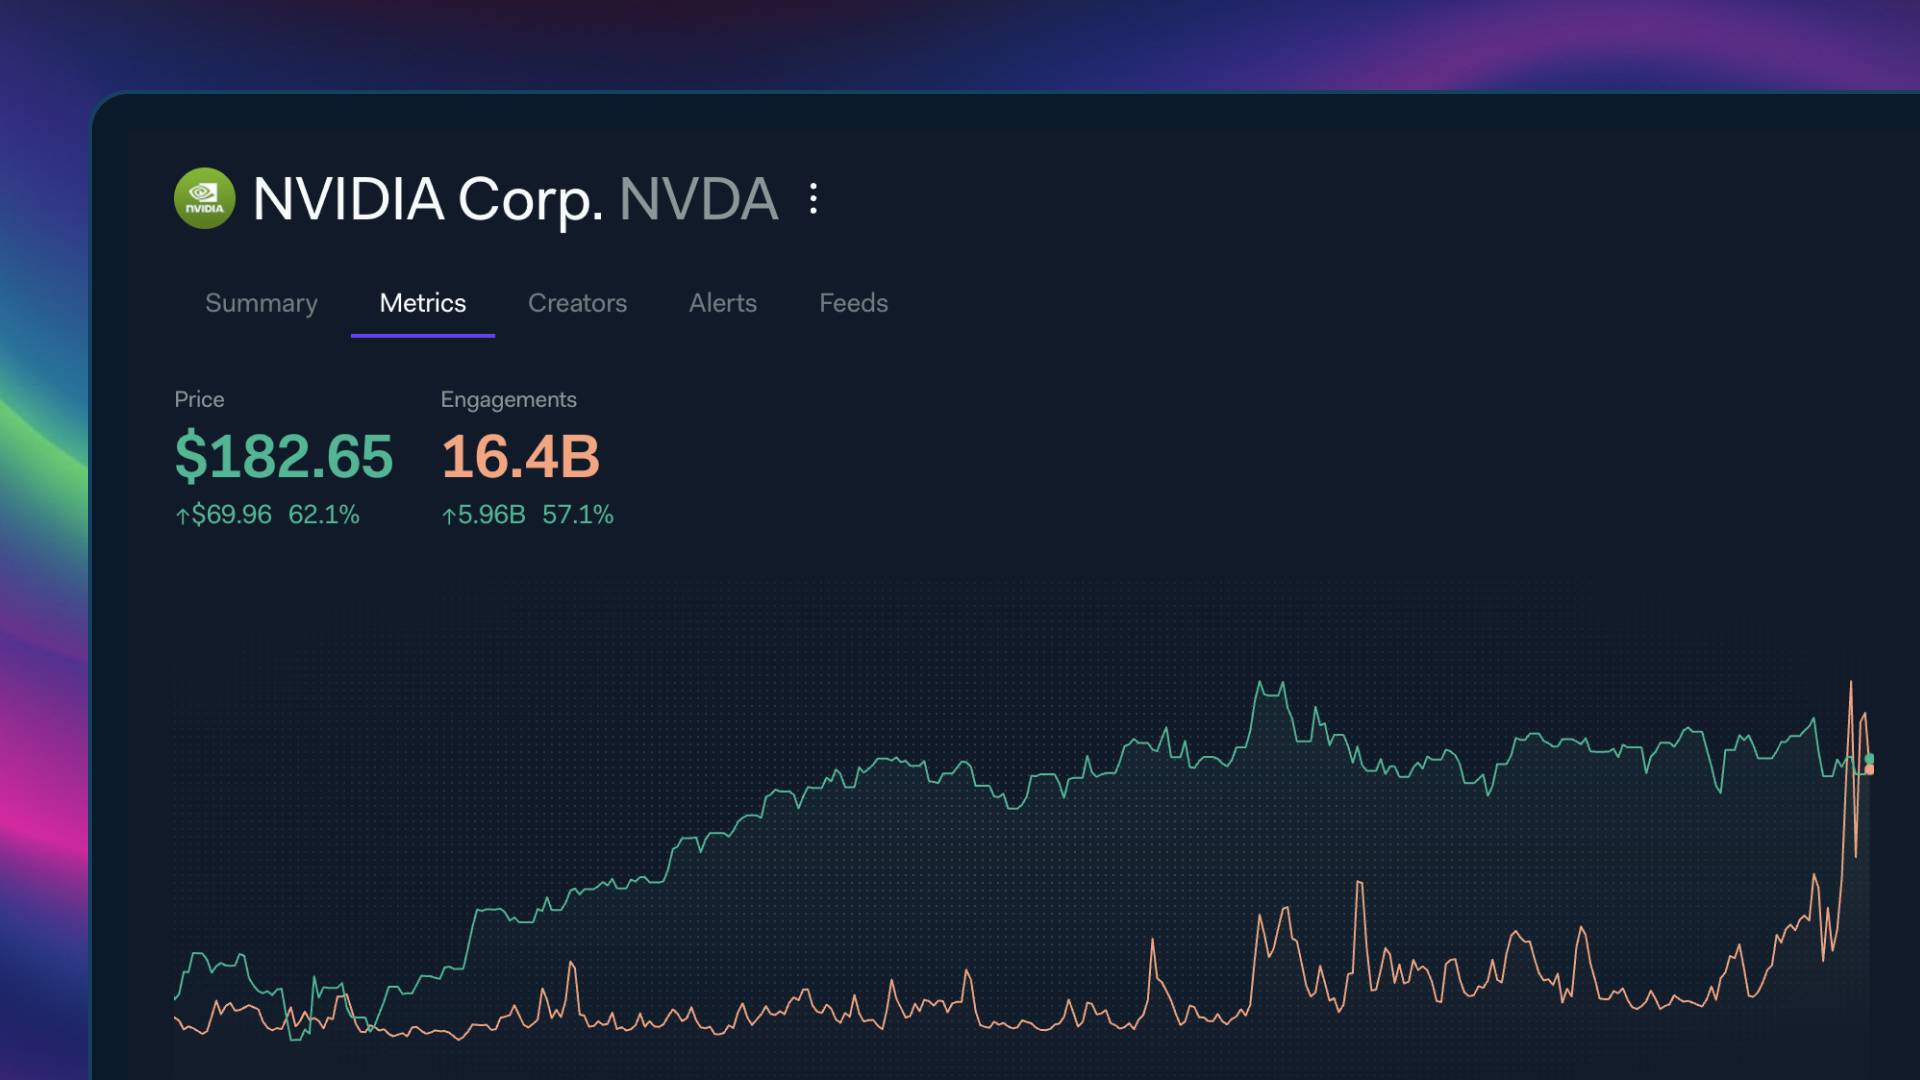
What's driving it? LunarCrush's narrative analysis shows the primary themes: anticipation around Q4 earnings, a major multi-year AI chip deal with Meta, and ongoing discussions about NVIDIA's competitive moat in AI infrastructure.
For an equity researcher, this data provides two things. First, a gauge of crowd expectations: when engagement is this elevated ahead of earnings, it signals that expectations are already priced high, which creates risk if results merely "meet" consensus. Second, a view into which narratives are dominant. If 30% of social discussion is about the Meta deal and only 10% is about competitive threats, you know what the crowd is focused on and, critically, what they might be underweighting.
Explore NVIDIA's full social profile at lunarcrush.com/topic/$nvda.
Apple ($AAPL): Social Momentum Divergence
Apple is trading at $274.20, up 6.18% over the last 30 days. Steady growth, nothing alarming. But the social data shows something more specific.
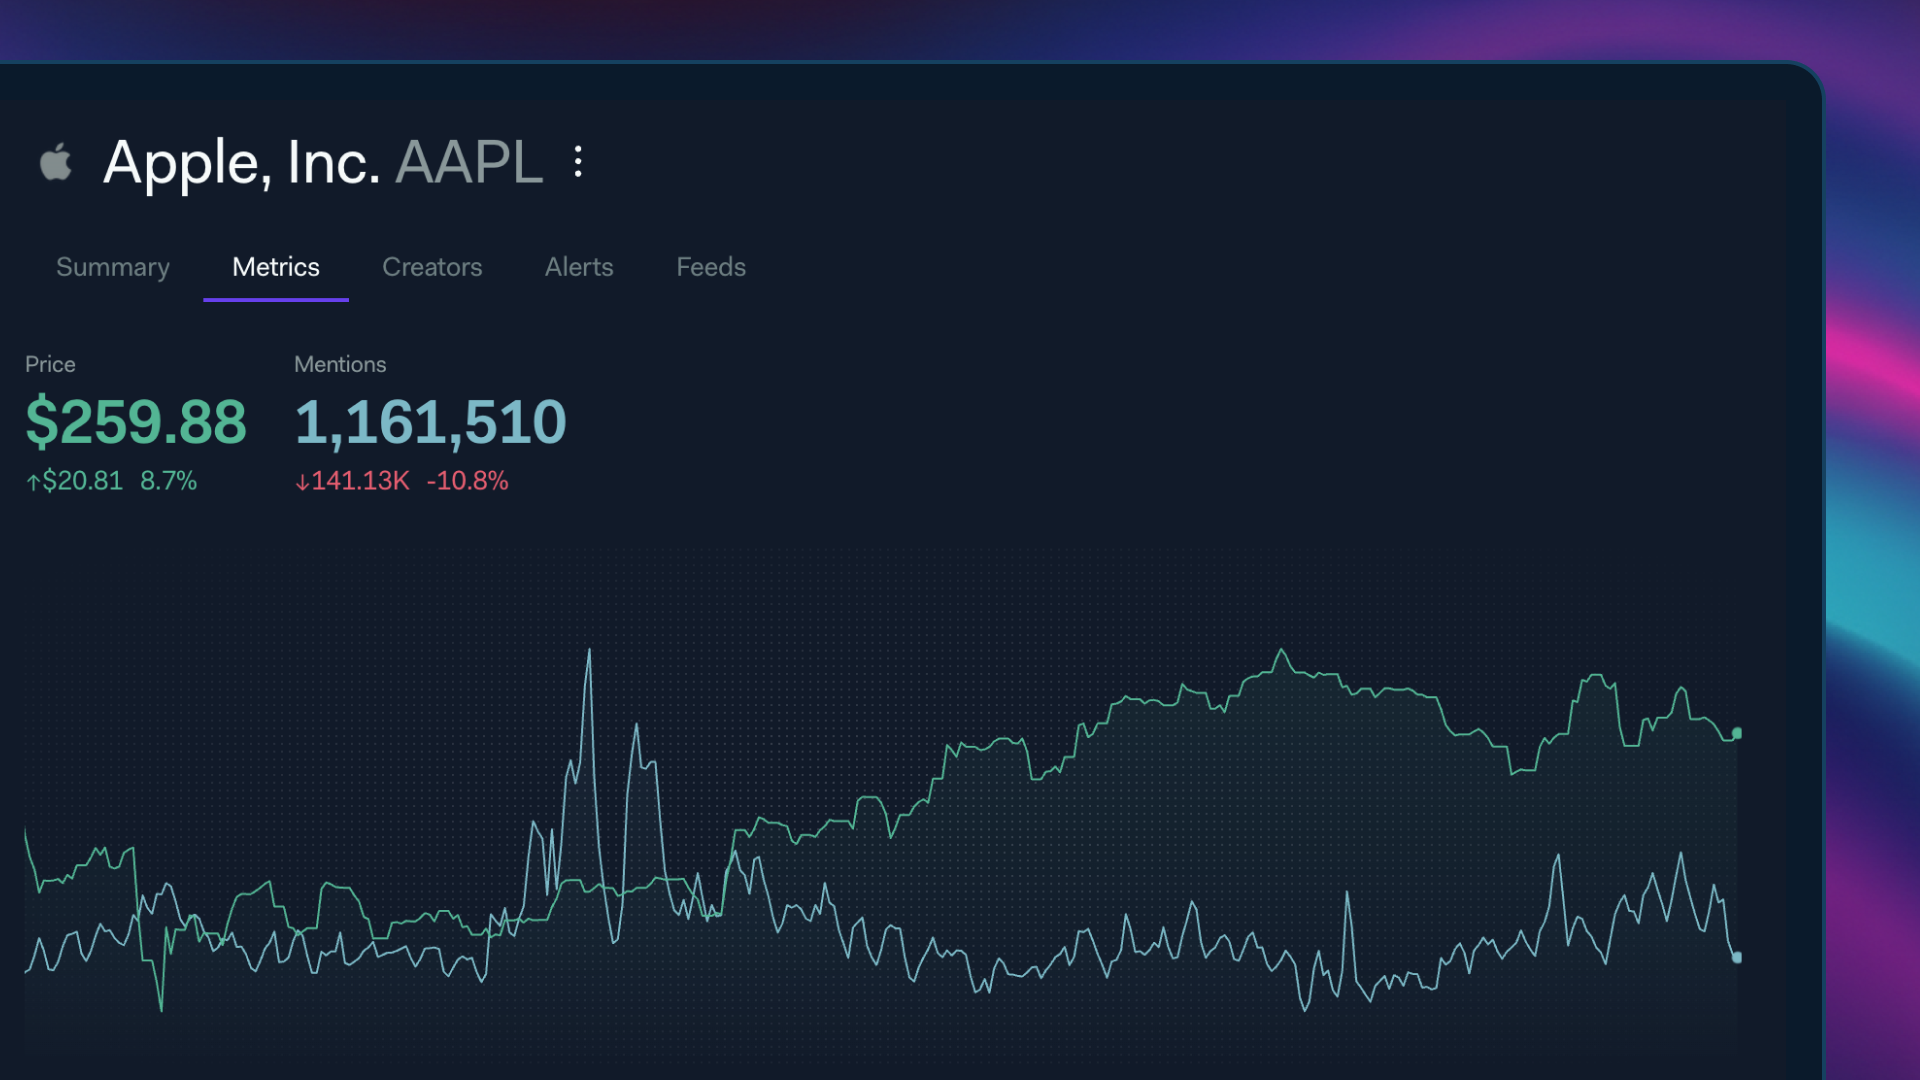
Apple's mentions just hit 24,700, which is 195% above its daily average. Social dominance is up 109% from the prior week. The narrative? Apple is reportedly planning to bring Mac Mini production to the US and has committed to purchasing over 100 million advanced chips from TSMC's Arizona facility. This is a domestic manufacturing narrative that intersects with broader geopolitical and trade themes.
The engagement breakdown by platform reveals where the conversation lives: X accounts for the vast majority at 3 million of Apple's 3.27 million daily engagements, with YouTube contributing 182,000 and Reddit at 8,700. For anyone building a content or advertising strategy around Apple-related themes, this platform distribution data is directly actionable.
See the full Apple social intelligence dashboard at lunarcrush.com/topic/$aapl.
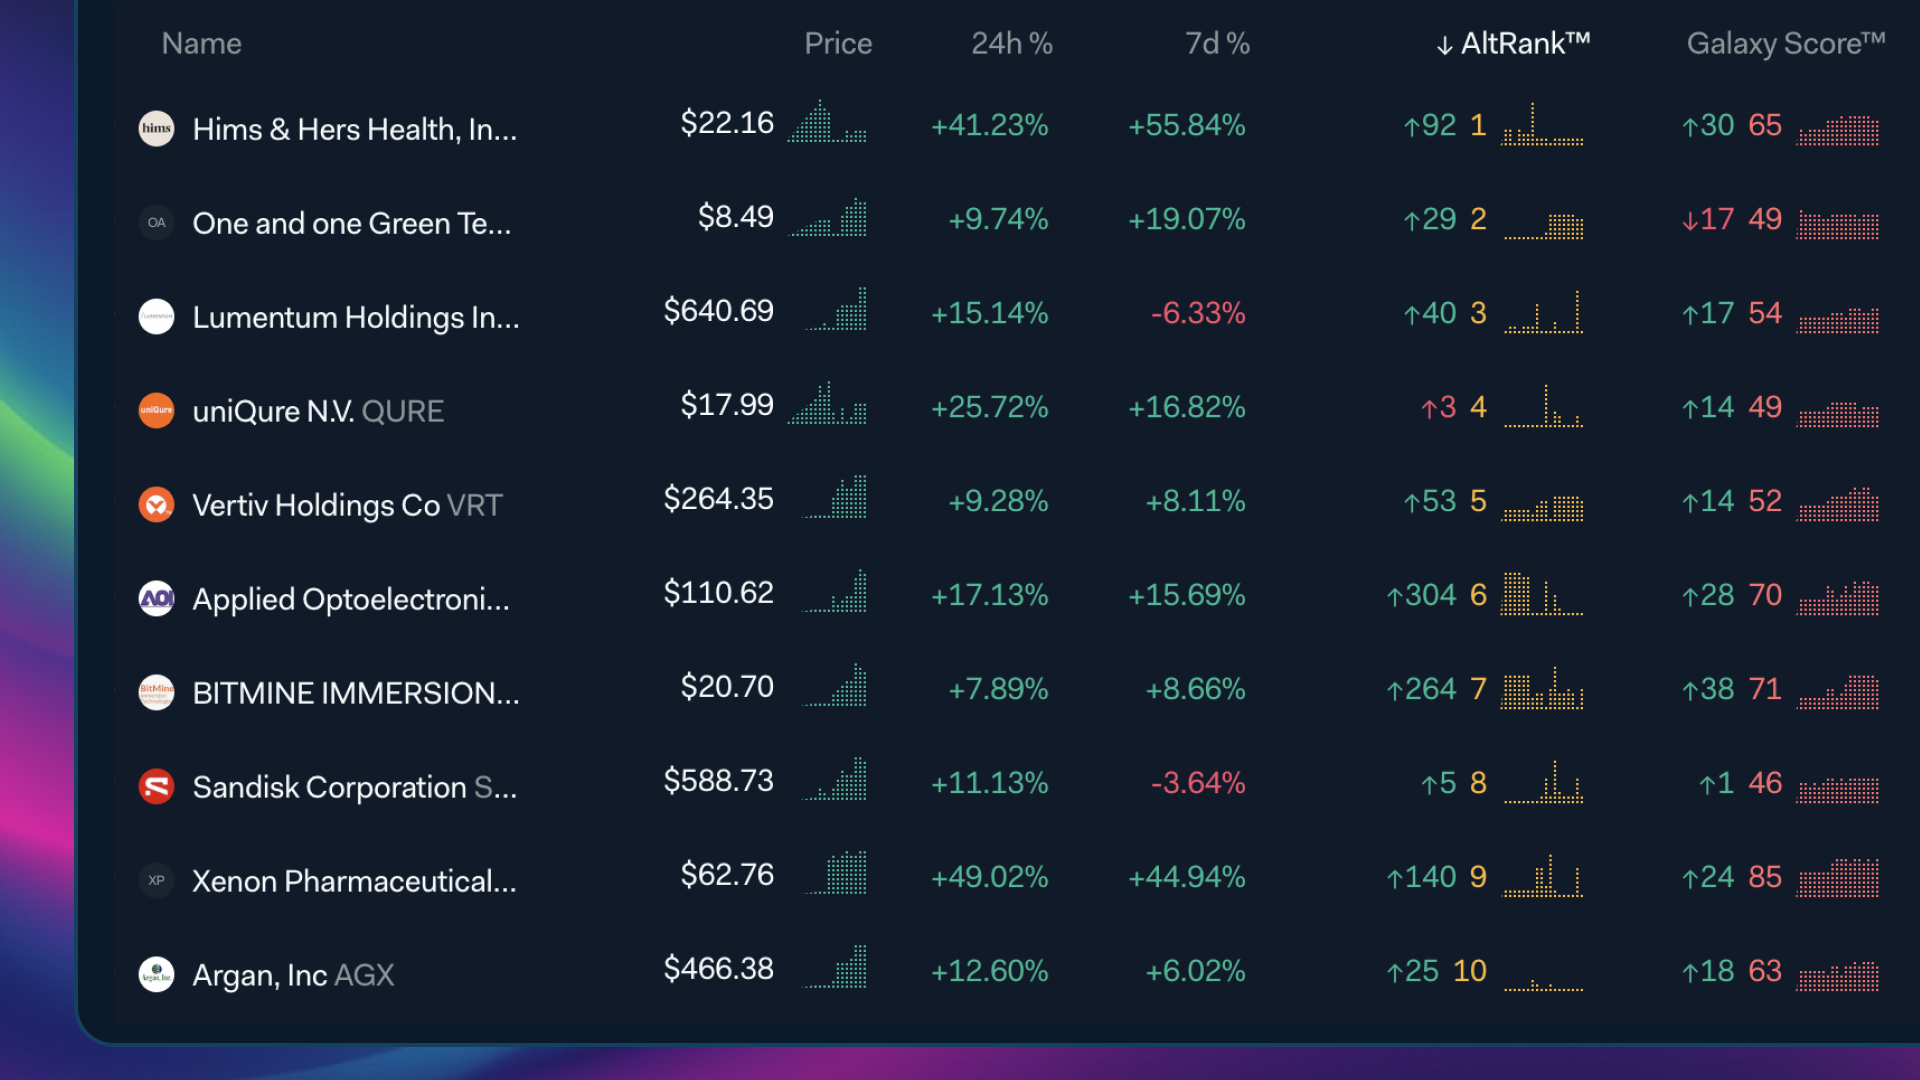
Galaxy Score and AltRank for Stocks
The same proprietary metrics that help crypto traders find momentum also work for equities.
Galaxy Score (0-100) combines social metrics with market performance to assess the overall health of a stock's social profile. A stock with a Galaxy Score above 70 has strong, positive social momentum that aligns with market performance. A score below 30 suggests the stock is either being ignored socially or discussed in a predominantly negative context.
AltRank ranks every stock against every other by combined social and market momentum. A stock at AltRank #1 has the strongest combined signal in the entire universe of tracked equities.
Right now, the top stocks by Galaxy Score include names like Cohen & Steers (CNS), hitting all-time price highs alongside a perfect Galaxy Score of 100, and Evercore (EVR), seeing a 94% surge in trading volume with top-tier social momentum. These aren't names you'd find in mainstream financial media headlines, which is exactly the point. Social intelligence surfaces signals that traditional coverage misses.
Browse the full stock rankings by Galaxy Score on LunarCrush.
Sector-Level Social Analysis
Individual stock analysis is useful. Sector-level patterns are where strategic insight lives.
LunarCrush categorizes stocks across sectors: technology, financial services, healthcare, energy, consumer cyclical, and more. Each sector has its own aggregate social metrics, allowing you to see where attention and sentiment are flowing at a macro level.
The current social landscape for stocks is shaped by three dominant positive themes: AI and technology advancements (30% of supportive social discussion), automotive industry innovations and EV developments (25%), and financial markets and investment strategy discussion (20%). On the critical side, economic uncertainty and market volatility (15%) and regulatory scrutiny and legal challenges (10%) are the most prominent concerns.
For portfolio managers, this is useful signal for understanding which sectors have positive social tailwinds versus headwinds. For individual investors, it helps explain why certain stocks are moving even when company-specific news is quiet: they're riding (or fighting) sector-level narrative currents.
Using the Claude Connector for Stock Research
The LunarCrush Connector for Claude works for stocks just as effectively as it does for crypto. Here are three prompts you can use right now:
Earnings prep:
NVIDIA earnings are coming up. Show me NVDA's social engagement, sentiment, and narrative themes over the last 30 days. What are the dominant themes, and how does current social momentum compare to previous earnings periods?
Sector rotation signal:
Which stock sectors have the highest social engagement growth over the last week? Are there any sectors where social momentum is rising but stock prices haven't caught up yet?
Competitive comparison:
Compare Mastercard ($MA) and Visa ($V) on social metrics. Which one has stronger social momentum right now, and what narratives are driving each? I'm specifically interested in the AI agents and stablecoins discussion.
Each of these queries returns real-time data from LunarCrush, interpreted by Claude with full context. You can explore the same comparisons visually on LunarCrush's comparison pages.
The Retail Signal Is the Market Signal
There's a tendency in institutional finance to dismiss social media data as noise: retail chatter, memes, and hype. This view is increasingly wrong.
Over 582,000 unique social media creators posted about stocks in the last 24 hours, up 2% from the prior day. That's not noise. That's a real-time consensus-formation mechanism involving more participants than most institutional surveys will ever reach.
When social engagement for a stock spikes 200% above its daily average, it's not a coincidence. It means something is happening: a breaking news event, a narrative shift, a coordinated retail push, or an information cascade that's about to translate into order flow. Dismissing that signal doesn't make it go away. It just means you're the last one to see it.
How to Start
Free exploration. Browse stock social data, rankings, and comparisons at lunarcrush.com. Every stock in the database has a dedicated topic page with real-time social metrics, sentiment, narrative themes, and creator activity.
AI-powered research. Connect LunarCrush to Claude at claude.ai and ask questions about any stock, sector, or comparison in natural language.
Programmatic access. The LunarCrush API provides full access to stock social data for developers building dashboards, alerts, or custom analysis tools.
Enterprise solutions. For funds, family offices, and financial institutions that need custom data feeds, watchlist monitoring, or integration with existing research platforms, LunarCrush Enterprise delivers tailored solutions.
Price Tells You What. Social Tells You Why.
The most dangerous assumption in equity research is that the market is efficient enough that social data doesn't matter. Every significant stock move in the last five years, from GameStop to NVIDIA's AI rally to Vanguard's ETF dominance, had a social signal that preceded or amplified it.
LunarCrush makes those signals visible, measurable, and actionable. Whether you're an individual investor checking sentiment before a trade or a fund building social data into a quantitative model, the social layer is no longer optional.