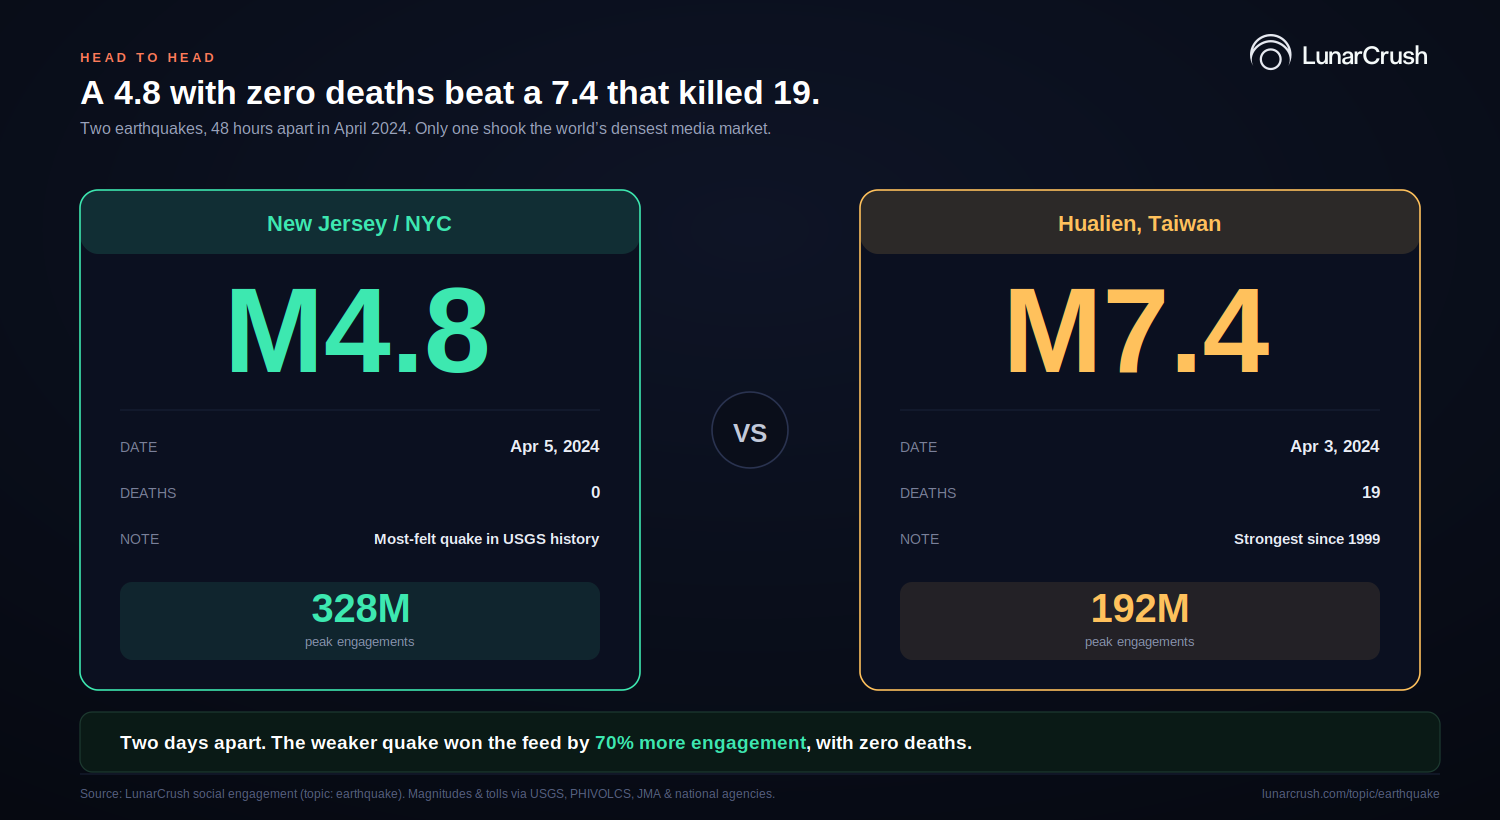
In April 2024, a magnitude 4.8 earthquake hit Tewksbury Township, New Jersey. No one died. Two days earlier, a magnitude 7.4 had struck Hualien, Taiwan, killing 19 people and toppling buildings. The 4.8 generated more social engagement than the 7.4.
That sounds like a glitch. It is the rule.
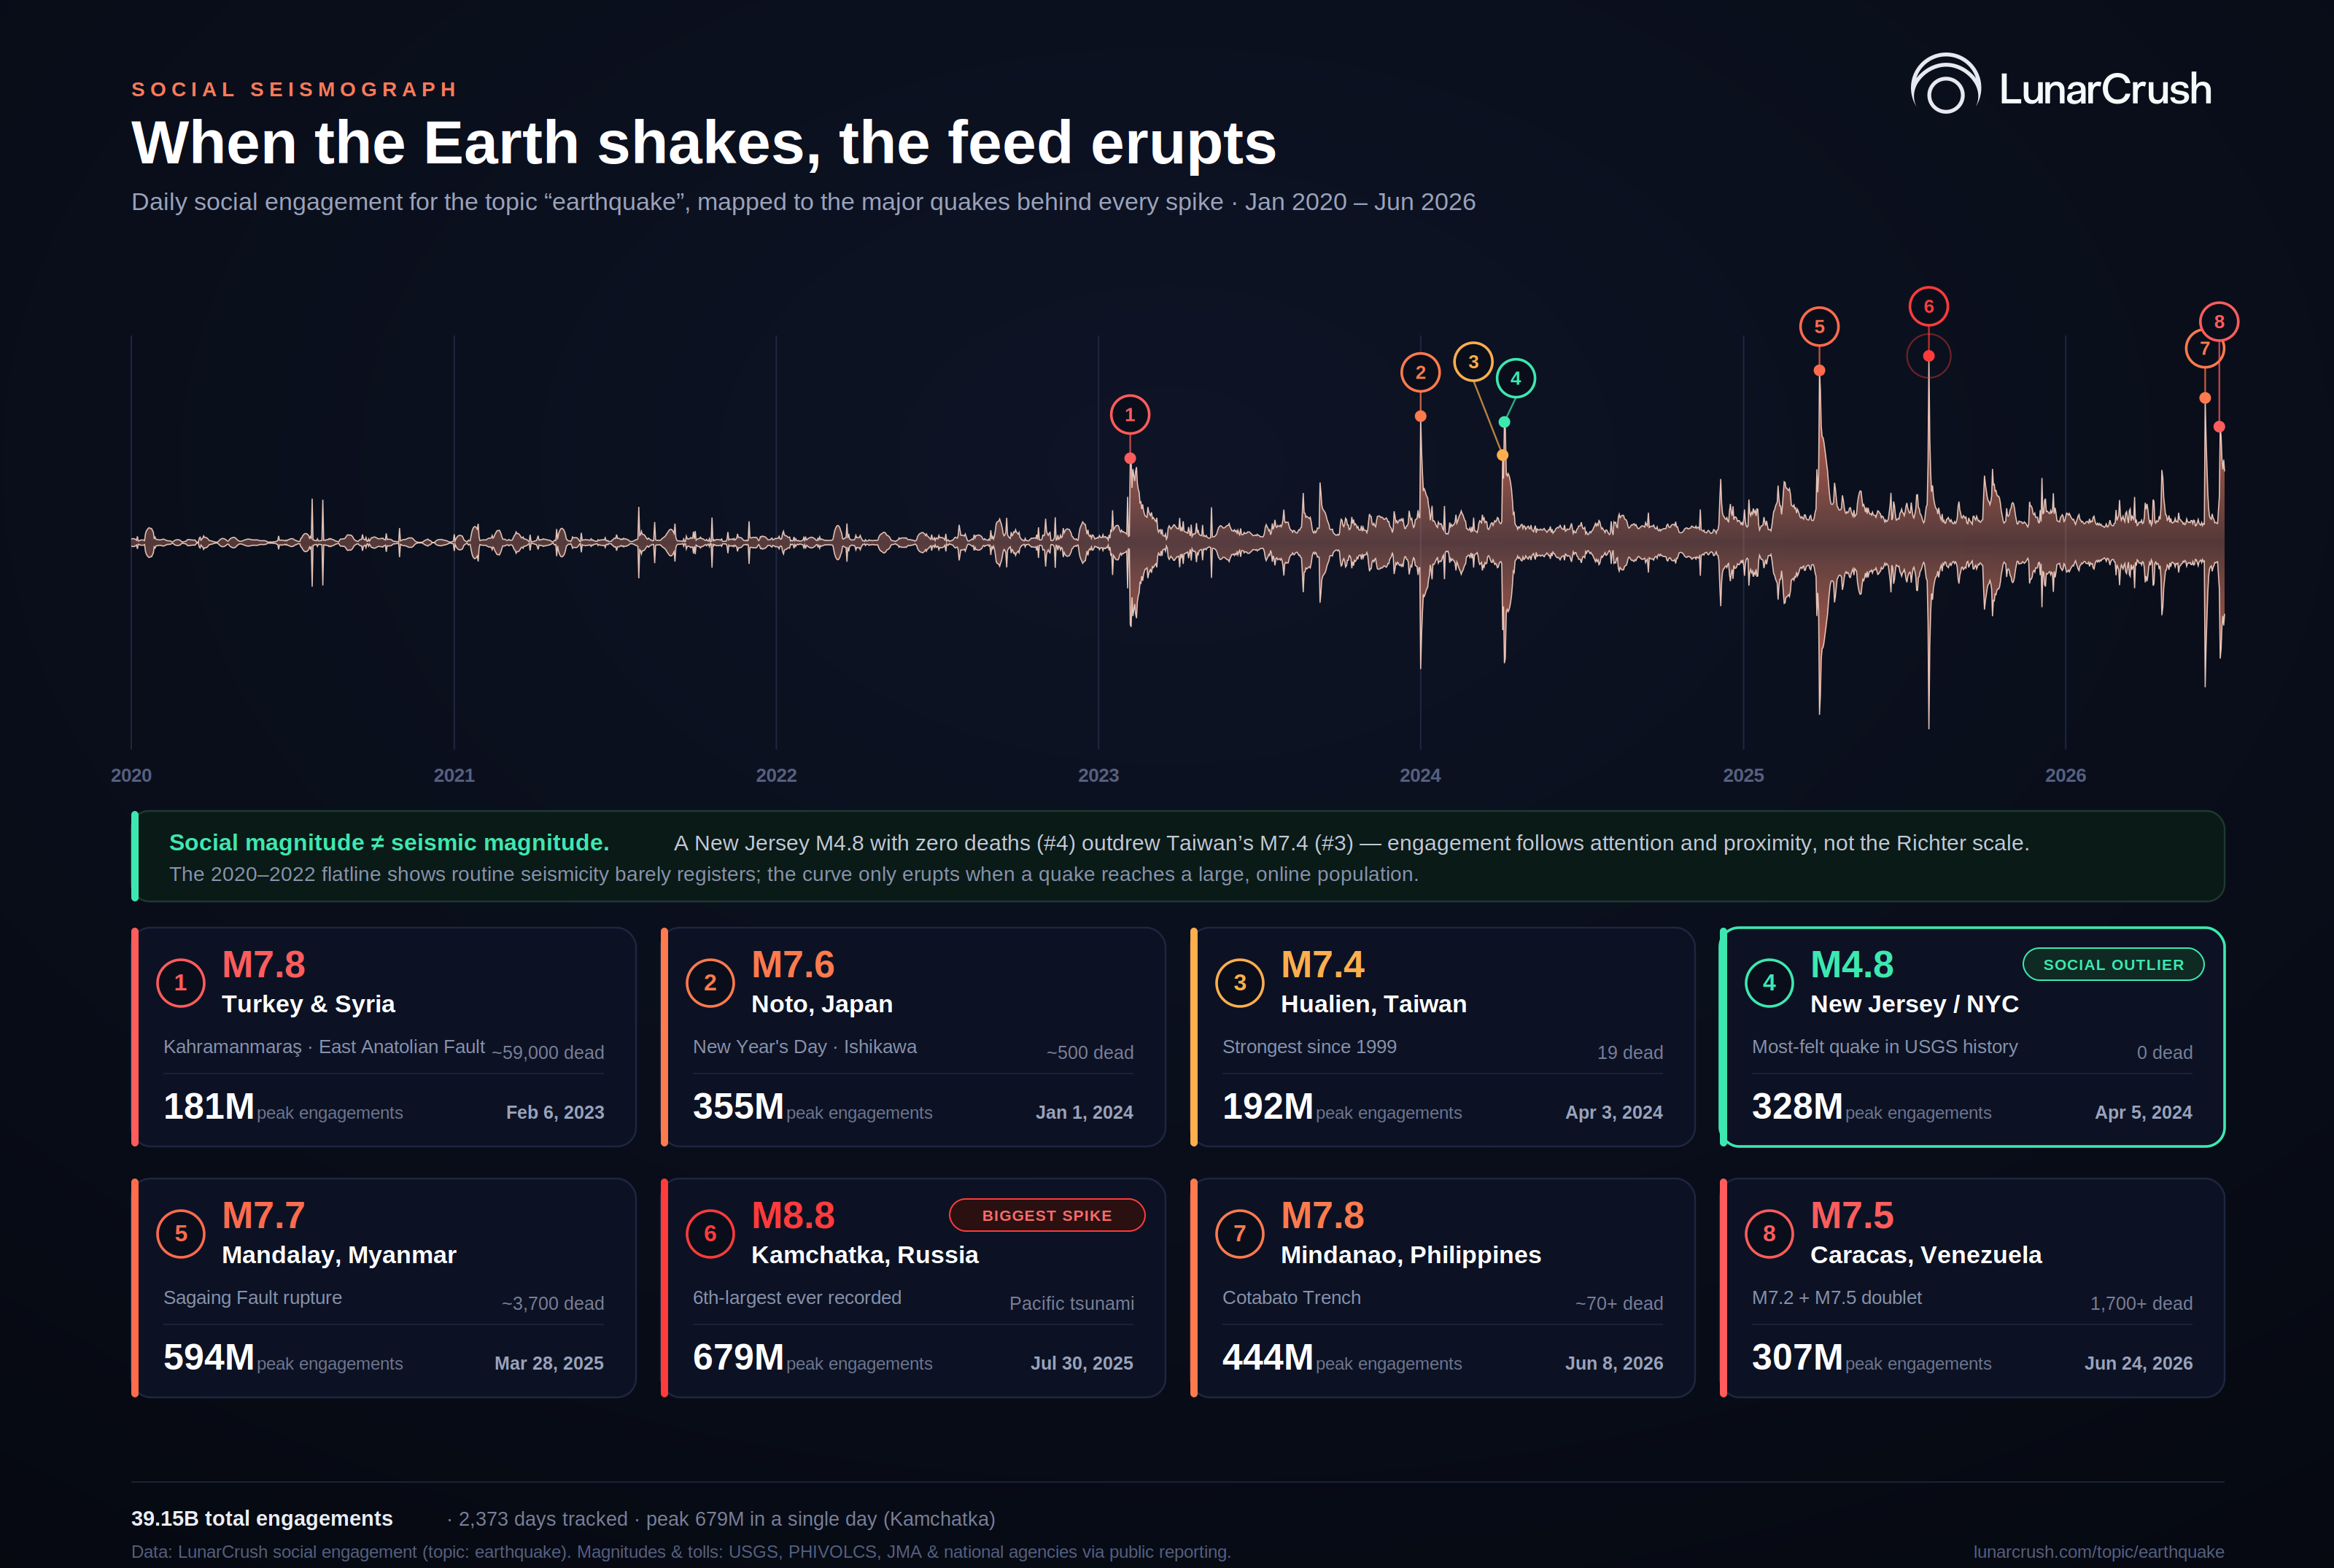
We took the "earthquake" topic on LunarCrush, pulled every day of engagement data back to January 2020, and matched each spike to the quake that caused it. The series holds 39.15 billion engagements across 2,373 days. Eight major events drive almost all of it. And the order they fall in has nothing to do with how big the quakes were or how many people they killed.
Social magnitude is not seismic magnitude
Here is the full ranking, by peak engagement on a single day:
Kamchatka, Russia — M8.8 — 679M.
July 30, 2025. The sixth-largest earthquake ever recorded by modern instruments, and the strongest anywhere since 2011. It triggered tsunami warnings across the Pacific and mass evacuations in Japan. It also killed almost no one.
Mandalay, Myanmar — M7.7 — 594M.
March 28, 2025. Roughly 3,700 dead. A skyscraper collapse 1,000 km away in Bangkok produced the footage that traveled fastest.
Mindanao, Philippines — M7.8 — 444M.
June 8, 2026. Tsunami alerts across the region.
Noto, Japan — M7.6 — 355M.
January 1, 2024. A New Year's Day disaster, around 500 lives lost.
New Jersey / NYC — M4.8 — 328M.
April 5, 2024. Zero deaths. The most-felt earthquake in USGS history, with more "Did You Feel It?" reports than any quake on record.
Caracas, Venezuela — M7.5 — 307M.
June 24, 2026. A rare doublet, M7.2 then M7.5, with more than 1,700 dead.
Hualien, Taiwan — M7.4 — 192M.
April 3, 2024. Nineteen dead, the strongest quake to hit Taiwan since 1999.
Turkey & Syria — M7.8 — 181M.
February 6, 2023. The deadliest event in the entire dataset, with roughly 59,000 lives lost. It sits dead last.
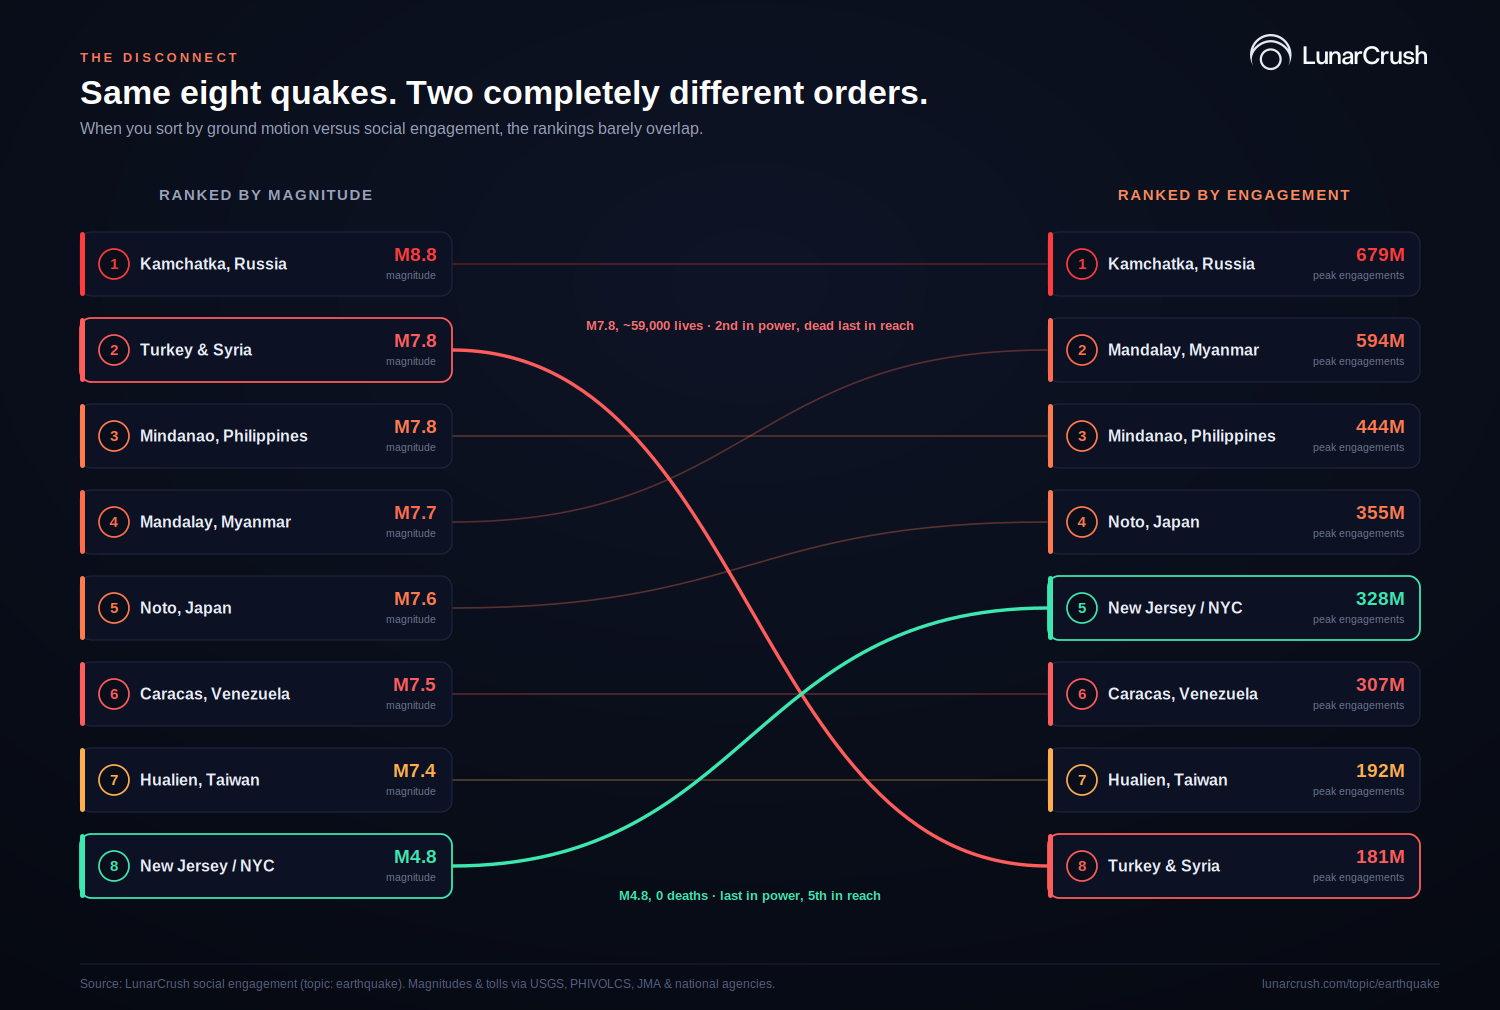
Read that list twice. The biggest social spike of the decade belongs to a quake that barely scratched a populated area. The single deadliest disaster in the data, a catastrophe that killed 59,000 people, produced the smallest spike of the eight.
Line the two rankings up side by side and the disconnect is total. Sort the eight quakes by magnitude, then sort them by engagement, and almost nothing stays in place. New Jersey climbs from last to fifth. Turkey falls from near the top to dead last.
The driver is reach, not Richter
The pattern is consistent once you stop expecting the feed to behave like a seismometer.
A quake goes viral when it shakes a dense, online, English-speaking population. The New Jersey 4.8 did almost no damage, but it rattled windows across the largest media market on Earth, and tens of millions of people reached for their phones at the same moment to ask the same question. That question, "did anyone else just feel that," is the engine. Personal proximity beats objective severity every time.
The Turkey and Syria earthquake is the clearest counterexample. It was massive and it was tragic. It also struck before dawn local time, in a region where the affected population skews away from the platforms LunarCrush tracks most heavily. Devastation does not automatically convert to engagement. Attention does.
Kamchatka proves the same point from the opposite direction. Hardly anyone died, yet it became the biggest spike on record because it became the biggest story: a once-in-a-generation magnitude, tsunami sirens from Russia to Hawaii, evacuation orders for nearly two million people in Japan. The threat was global, the coverage was wall to wall, and the feed responded to the spectacle, not the body count.
What the flatline tells you
The first three years of the chart are nearly silent. From 2020 through 2022, the "earthquake" topic runs along a low baseline, even though the planet produced its usual run of significant quakes the entire time. Those three years account for just 5.8% of all engagement in the dataset. The year 2025 alone, carried by Kamchatka and Myanmar, accounts for 43.6%.
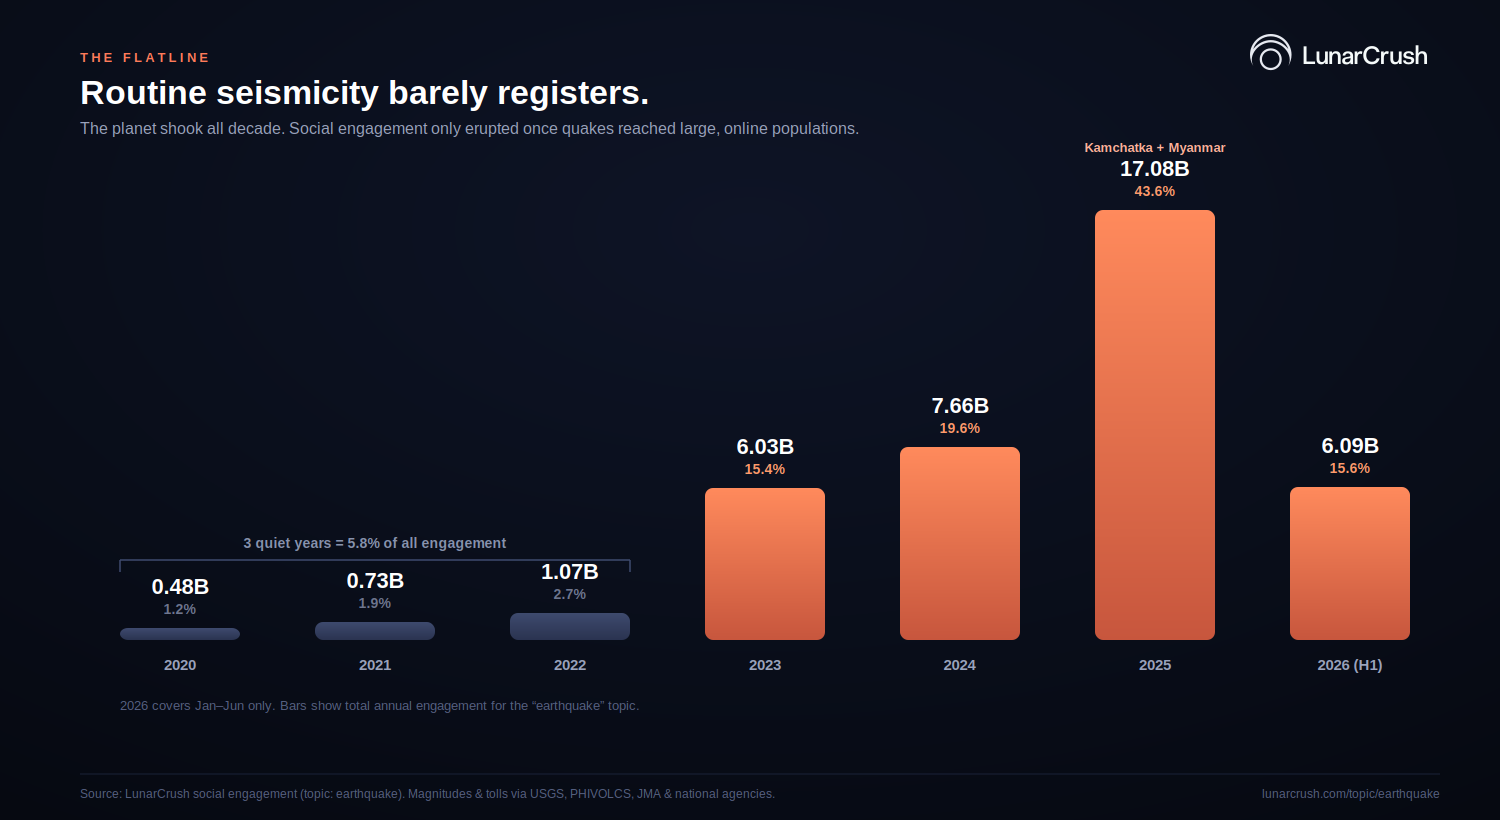
Routine seismicity does not register socially. The curve only erupts when an event crosses a threshold of personal relevance for a large enough online audience.
That silence is the most useful part of the picture. It tells you that social engagement is not a measure of what happened. It is a measure of what people decided to care about. Those are different things, and the gap between them is where the signal lives.
Why this matters beyond earthquakes
Earthquakes make a clean case study because the underlying event has an objective magnitude. You can line up "how big was it" against "how much did people post" and watch the two diverge. Most topics do not give you that luxury. A token, a stock, a brand, a team: there is no Richter scale to check the engagement against.
So the lesson transfers. Engagement is a market for attention, and attention does not price things by their true size. It prices them by proximity, by timing, by who is online, and by how shareable the moment is. If you are reading social data to anticipate what moves next, that distinction is everything. The crowd is not telling you what is important. It is telling you what it is paying attention to, which is often the more tradable signal.
A magnitude 4.8 in the right place can outrun a 7.4. Once you internalize that, you stop reading volume as truth and start reading it as attention. That is the whole game.
Built with the LunarCrush MCP. Every number above comes from the live "earthquake" topic, grounded in real social data. Magnitudes and death tolls are sourced from USGS, PHIVOLCS, JMA, and national agencies via public reporting. Explore the topic or build on the data.