DeFi exploits do not announce themselves on a schedule. When a bridge gets drained or a lending protocol hits 100% utilization, the first signals show up in social data: sudden mention spikes, sentiment theme shifts, and cross-chain chatter that spreads faster than any official post-mortem. The LunarCrush MCP server lets you plug that social signal layer directly into Claude, turning conversation intelligence into a programmable risk monitor.
This tutorial walks through building that system from scratch. Each step includes the exact prompt to use, what the output looks like, and where the workflow becomes visual.
Step 1: Connect the LunarCrush MCP Server to Claude
Before you can query live social data, Claude needs access to the LunarCrush MCP server. Navigate to https://lunarcrush.com/developers/api/ai and follow the setup instructions for your environment (Claude Desktop, Claude Code, or the API via the Anthropic SDK).
Once connected, verify the connection by running a simple test query.
Prompt to use:
Using the LunarCrush MCP server, pull the current topic summary for Ethereum.
What you should see: Claude returns a structured response including Ethereum's current price, Galaxy Score, AltRank, sentiment percentage, social dominance, engagement count, mention count, creator count, and AI-generated sentiment themes with percentage weights.
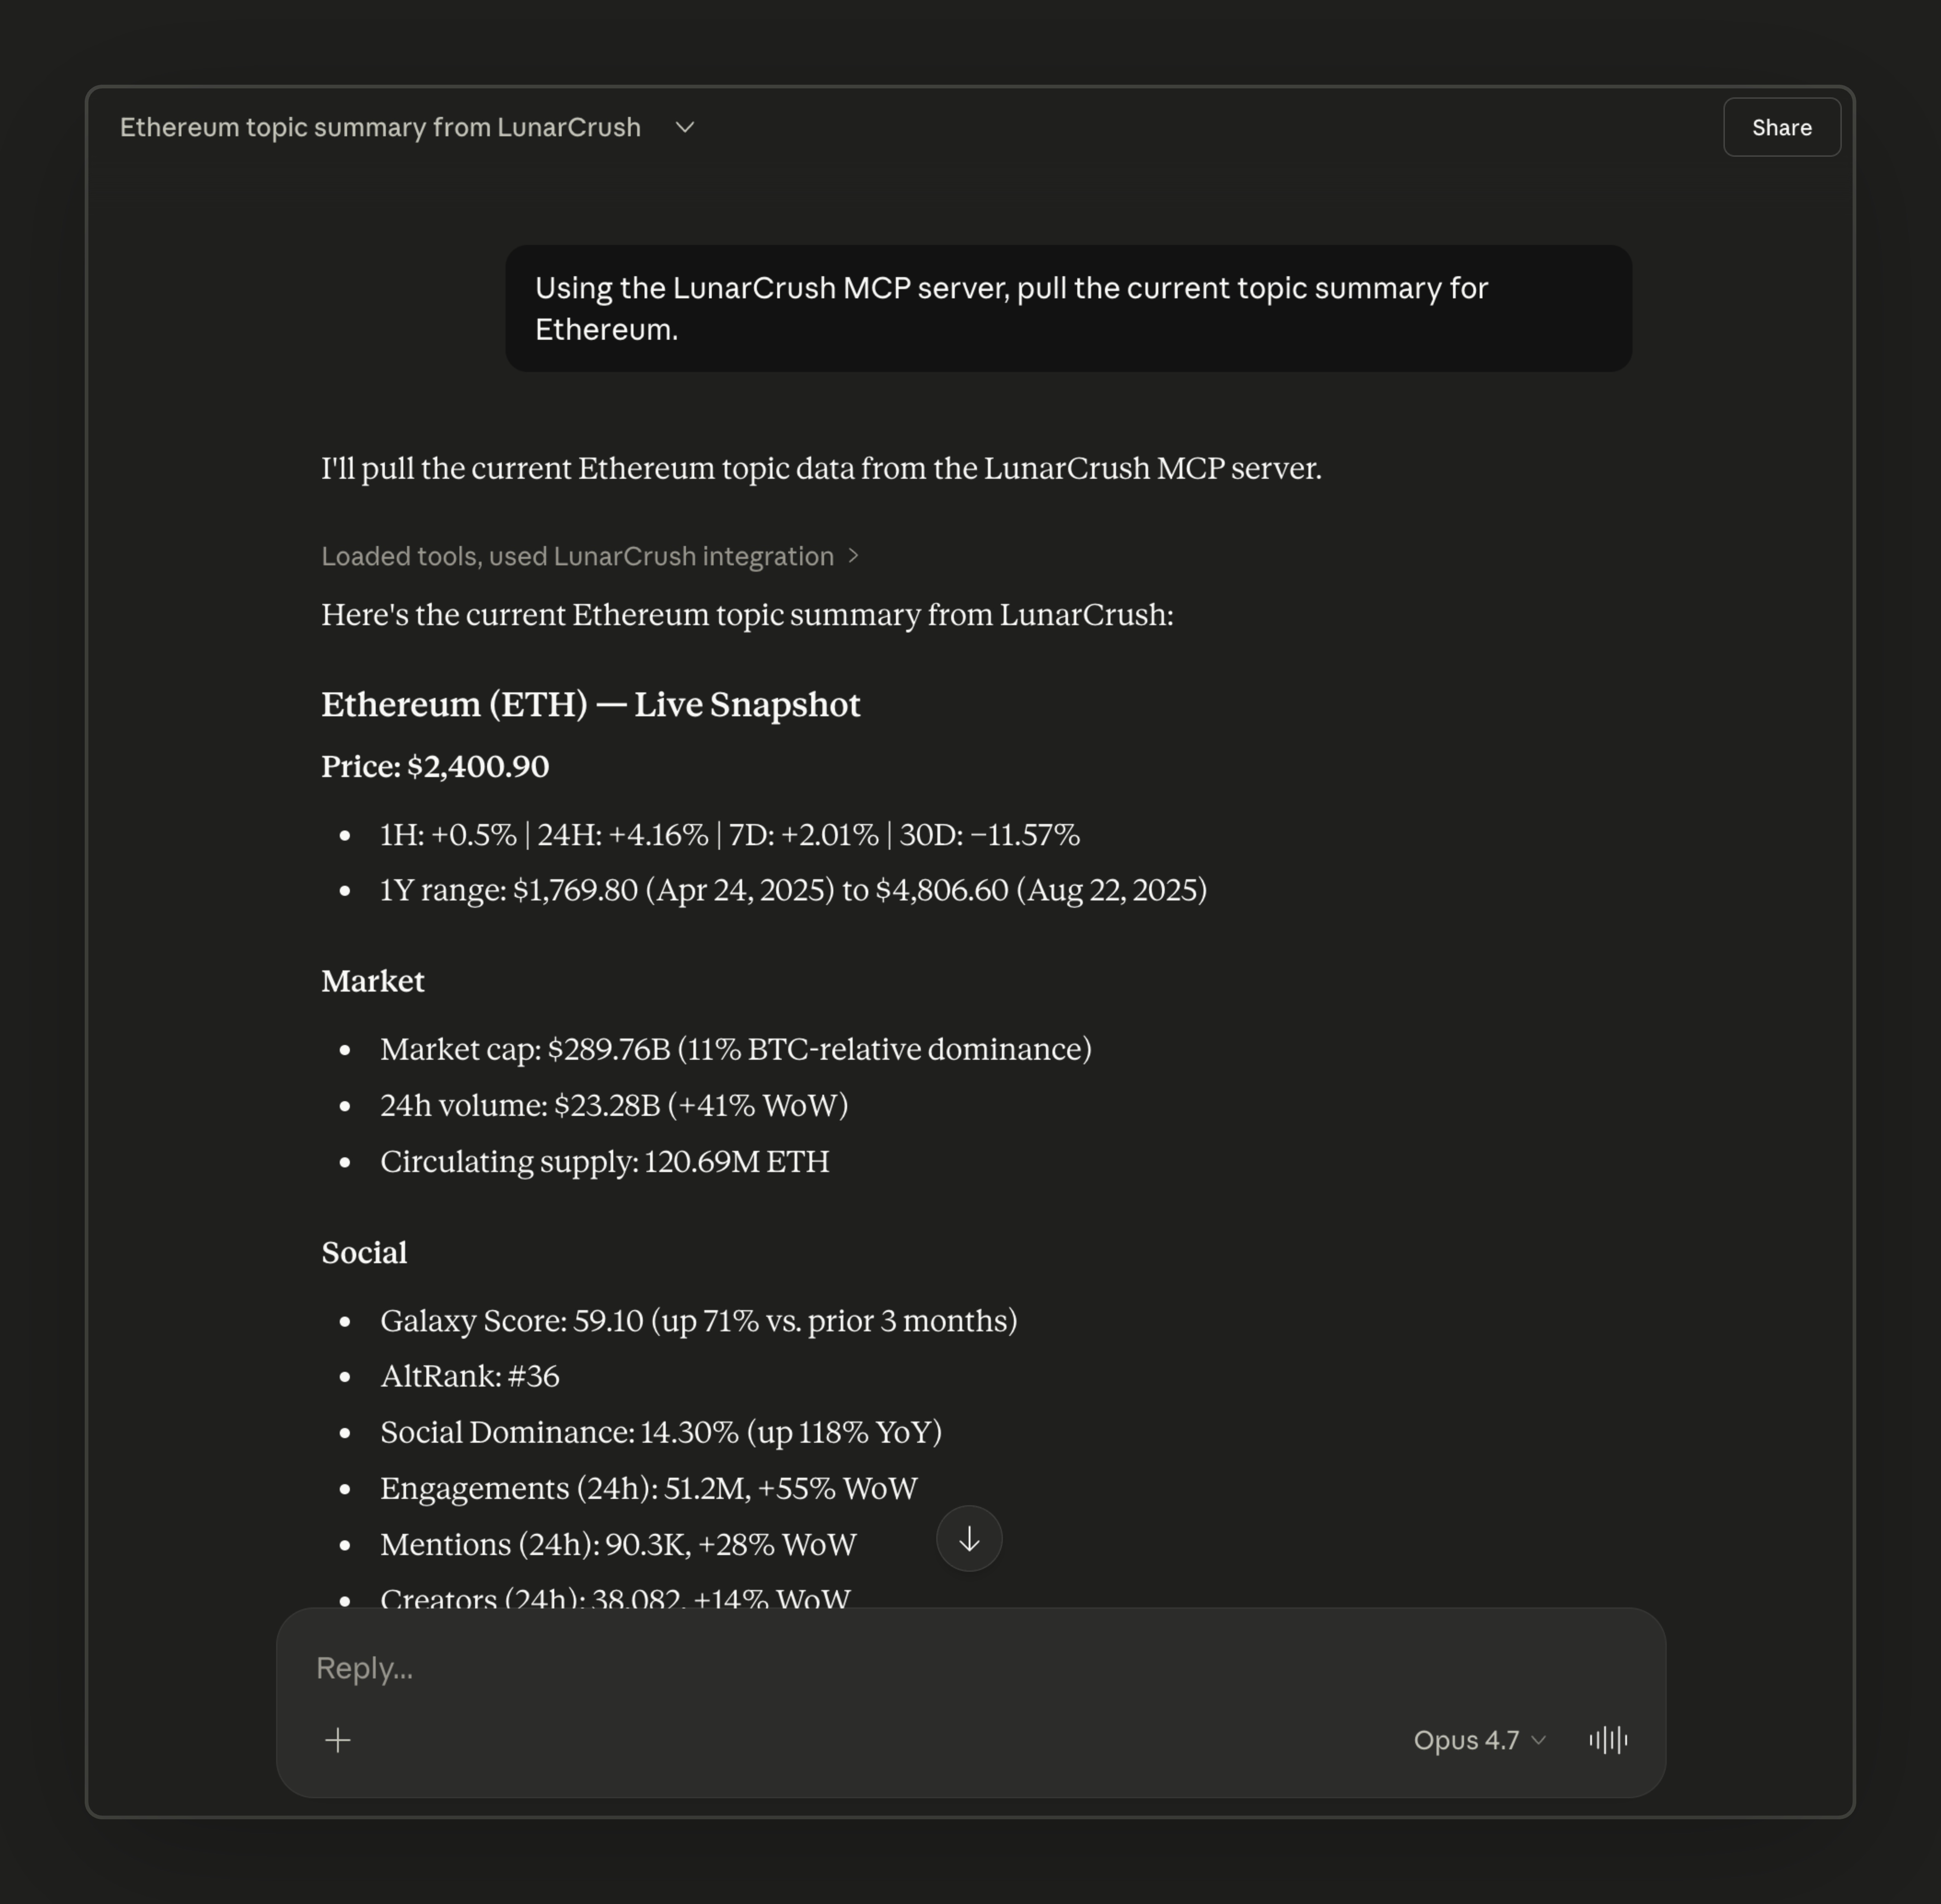
If you see this output, your MCP connection is working. If Claude says it cannot find the LunarCrush tools, revisit the MCP configuration step.
Step 2: Establish Your Baseline Metrics
A risk alert system needs to know what "normal" looks like before it can flag anomalies. Pull baseline data for the DeFi assets you want to monitor.
Prompt to use:
What you should see: A ranked list of DeFi tokens by AltRank, followed by detailed summaries for the top 5. Record these numbers as your baseline. Key fields to track: AltRank (daily average vs. current), sentiment percentage, mention count (weekly trend), and the sentiment theme breakdown.
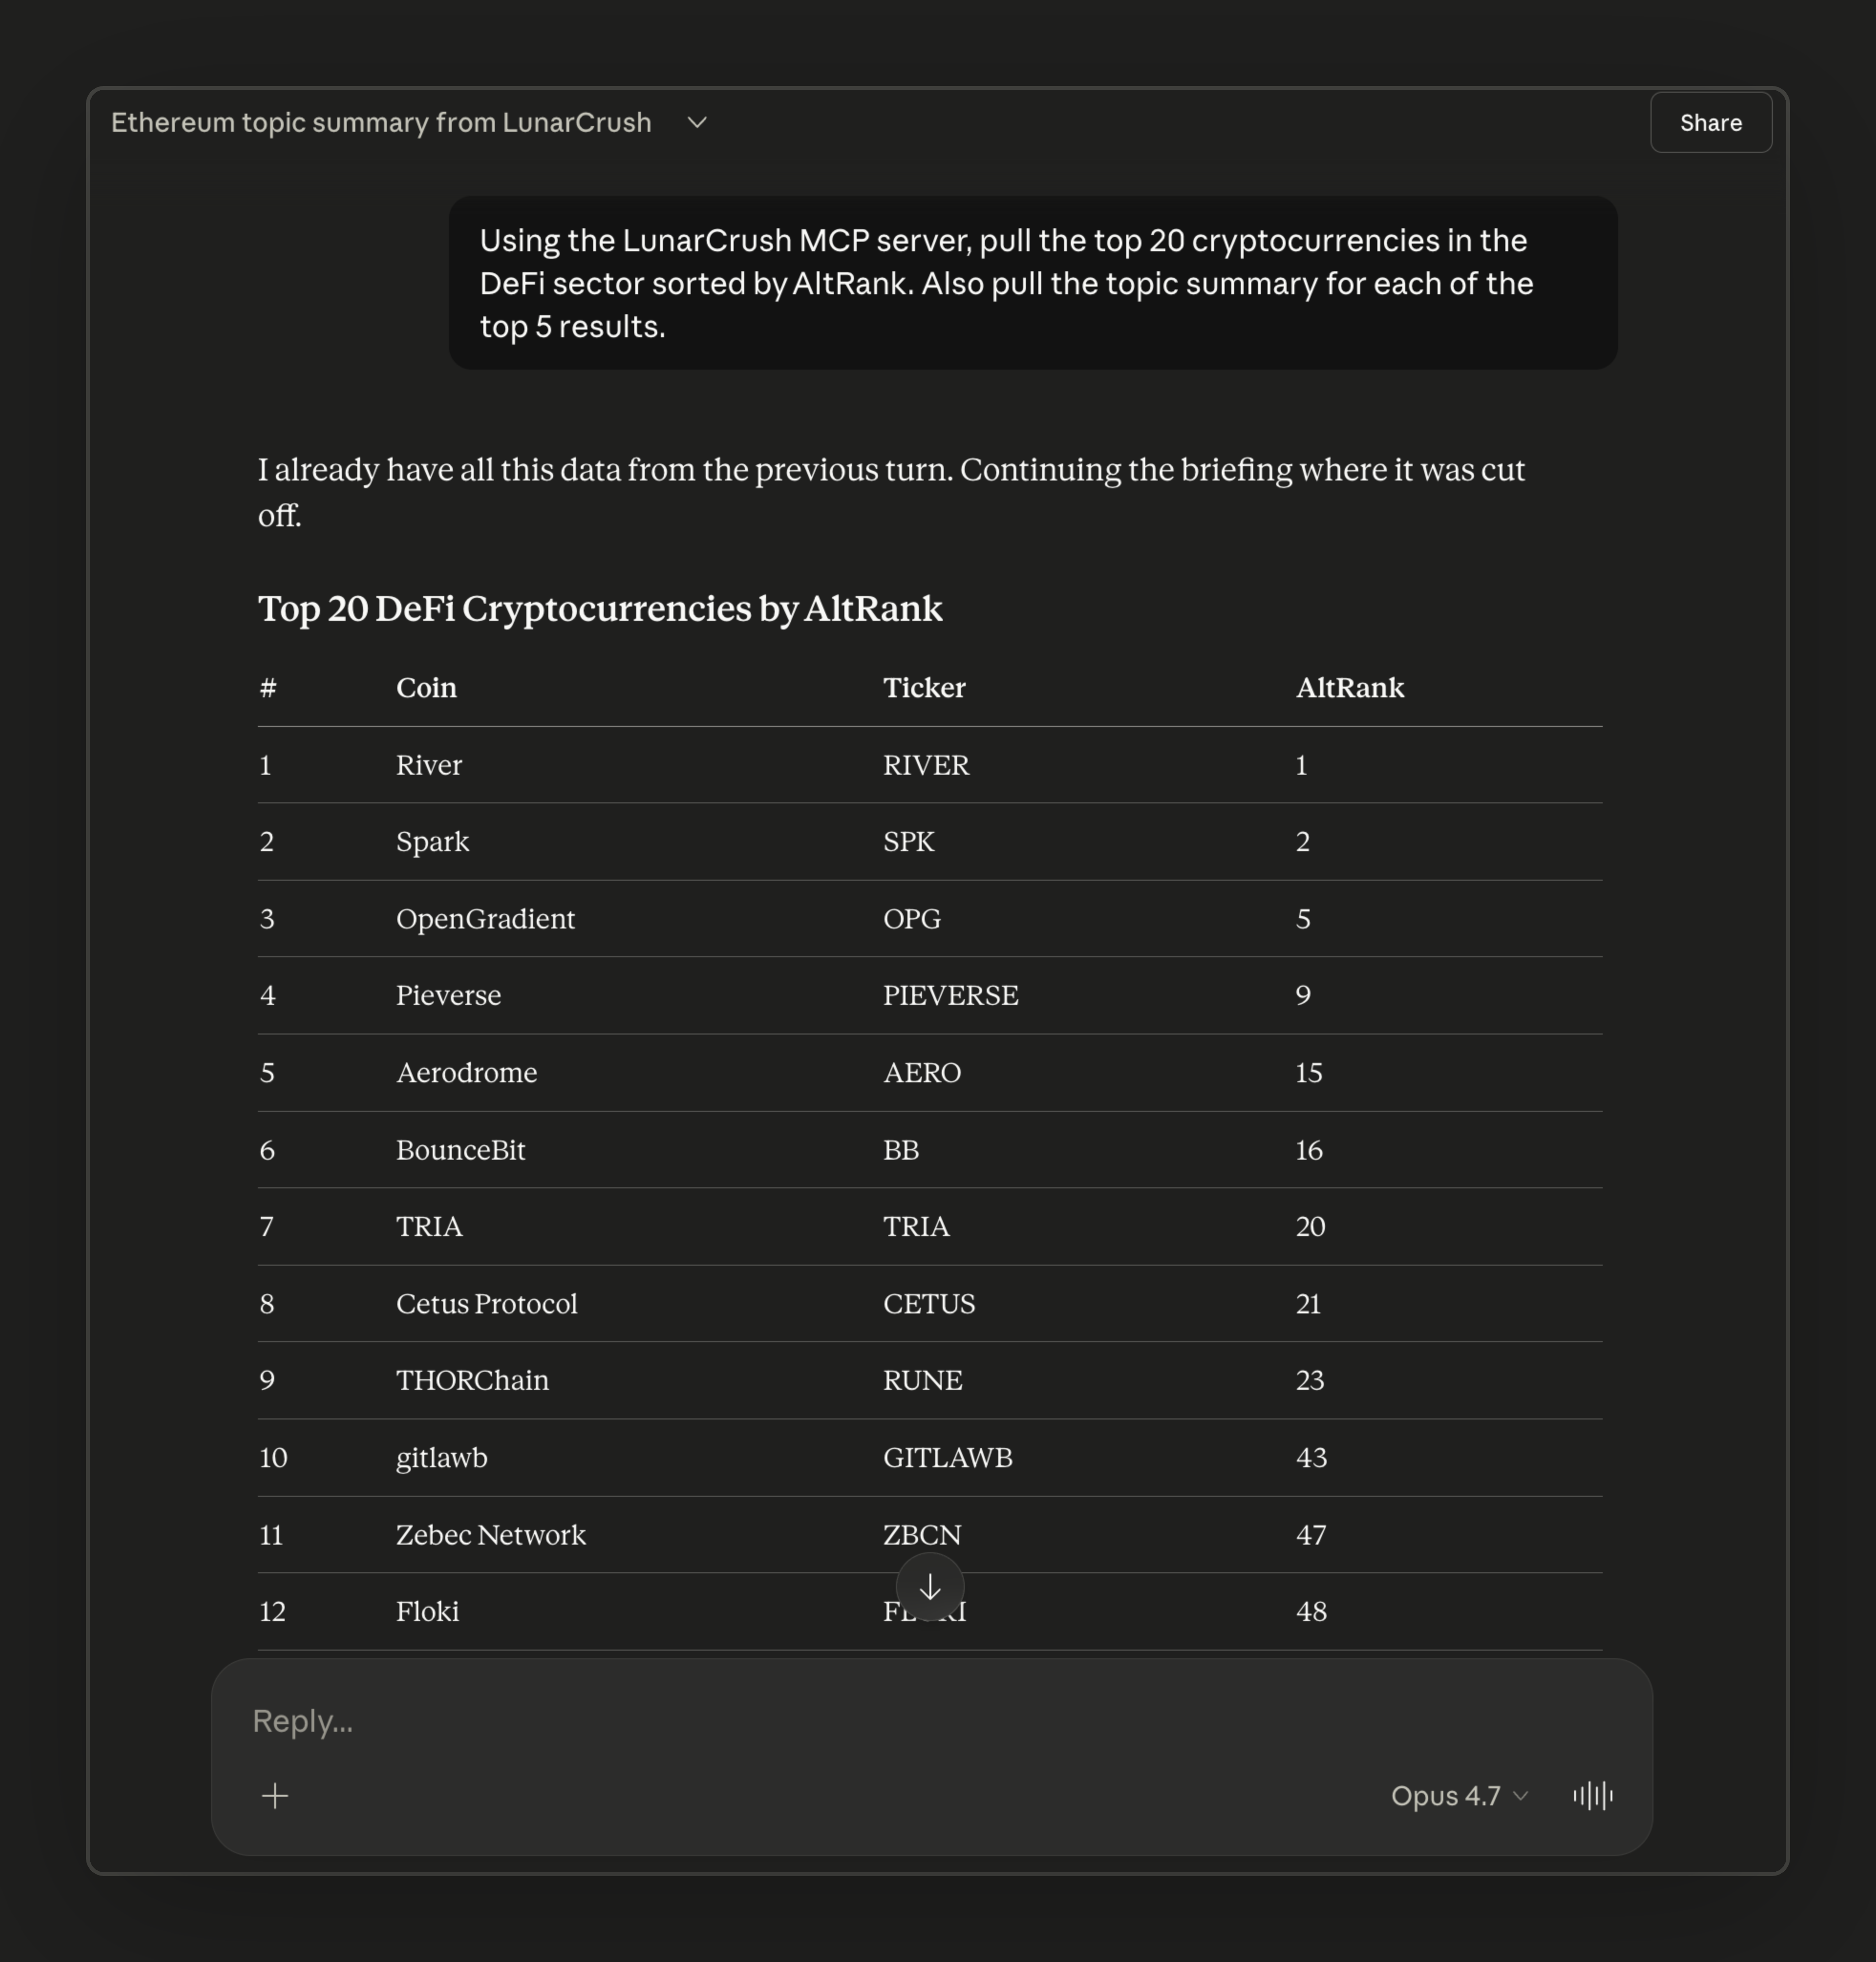
Why this matters: When a protocol's AltRank weakens 30% or more below its daily average, or when its sentiment themes shift from majority-supportive to majority-critical, something has changed. You need the baseline to detect that shift.
Step 3: Build Your Monitoring Query
Now create the prompt that will serve as your recurring risk check. This is the core of your alert system.
Prompt to use:
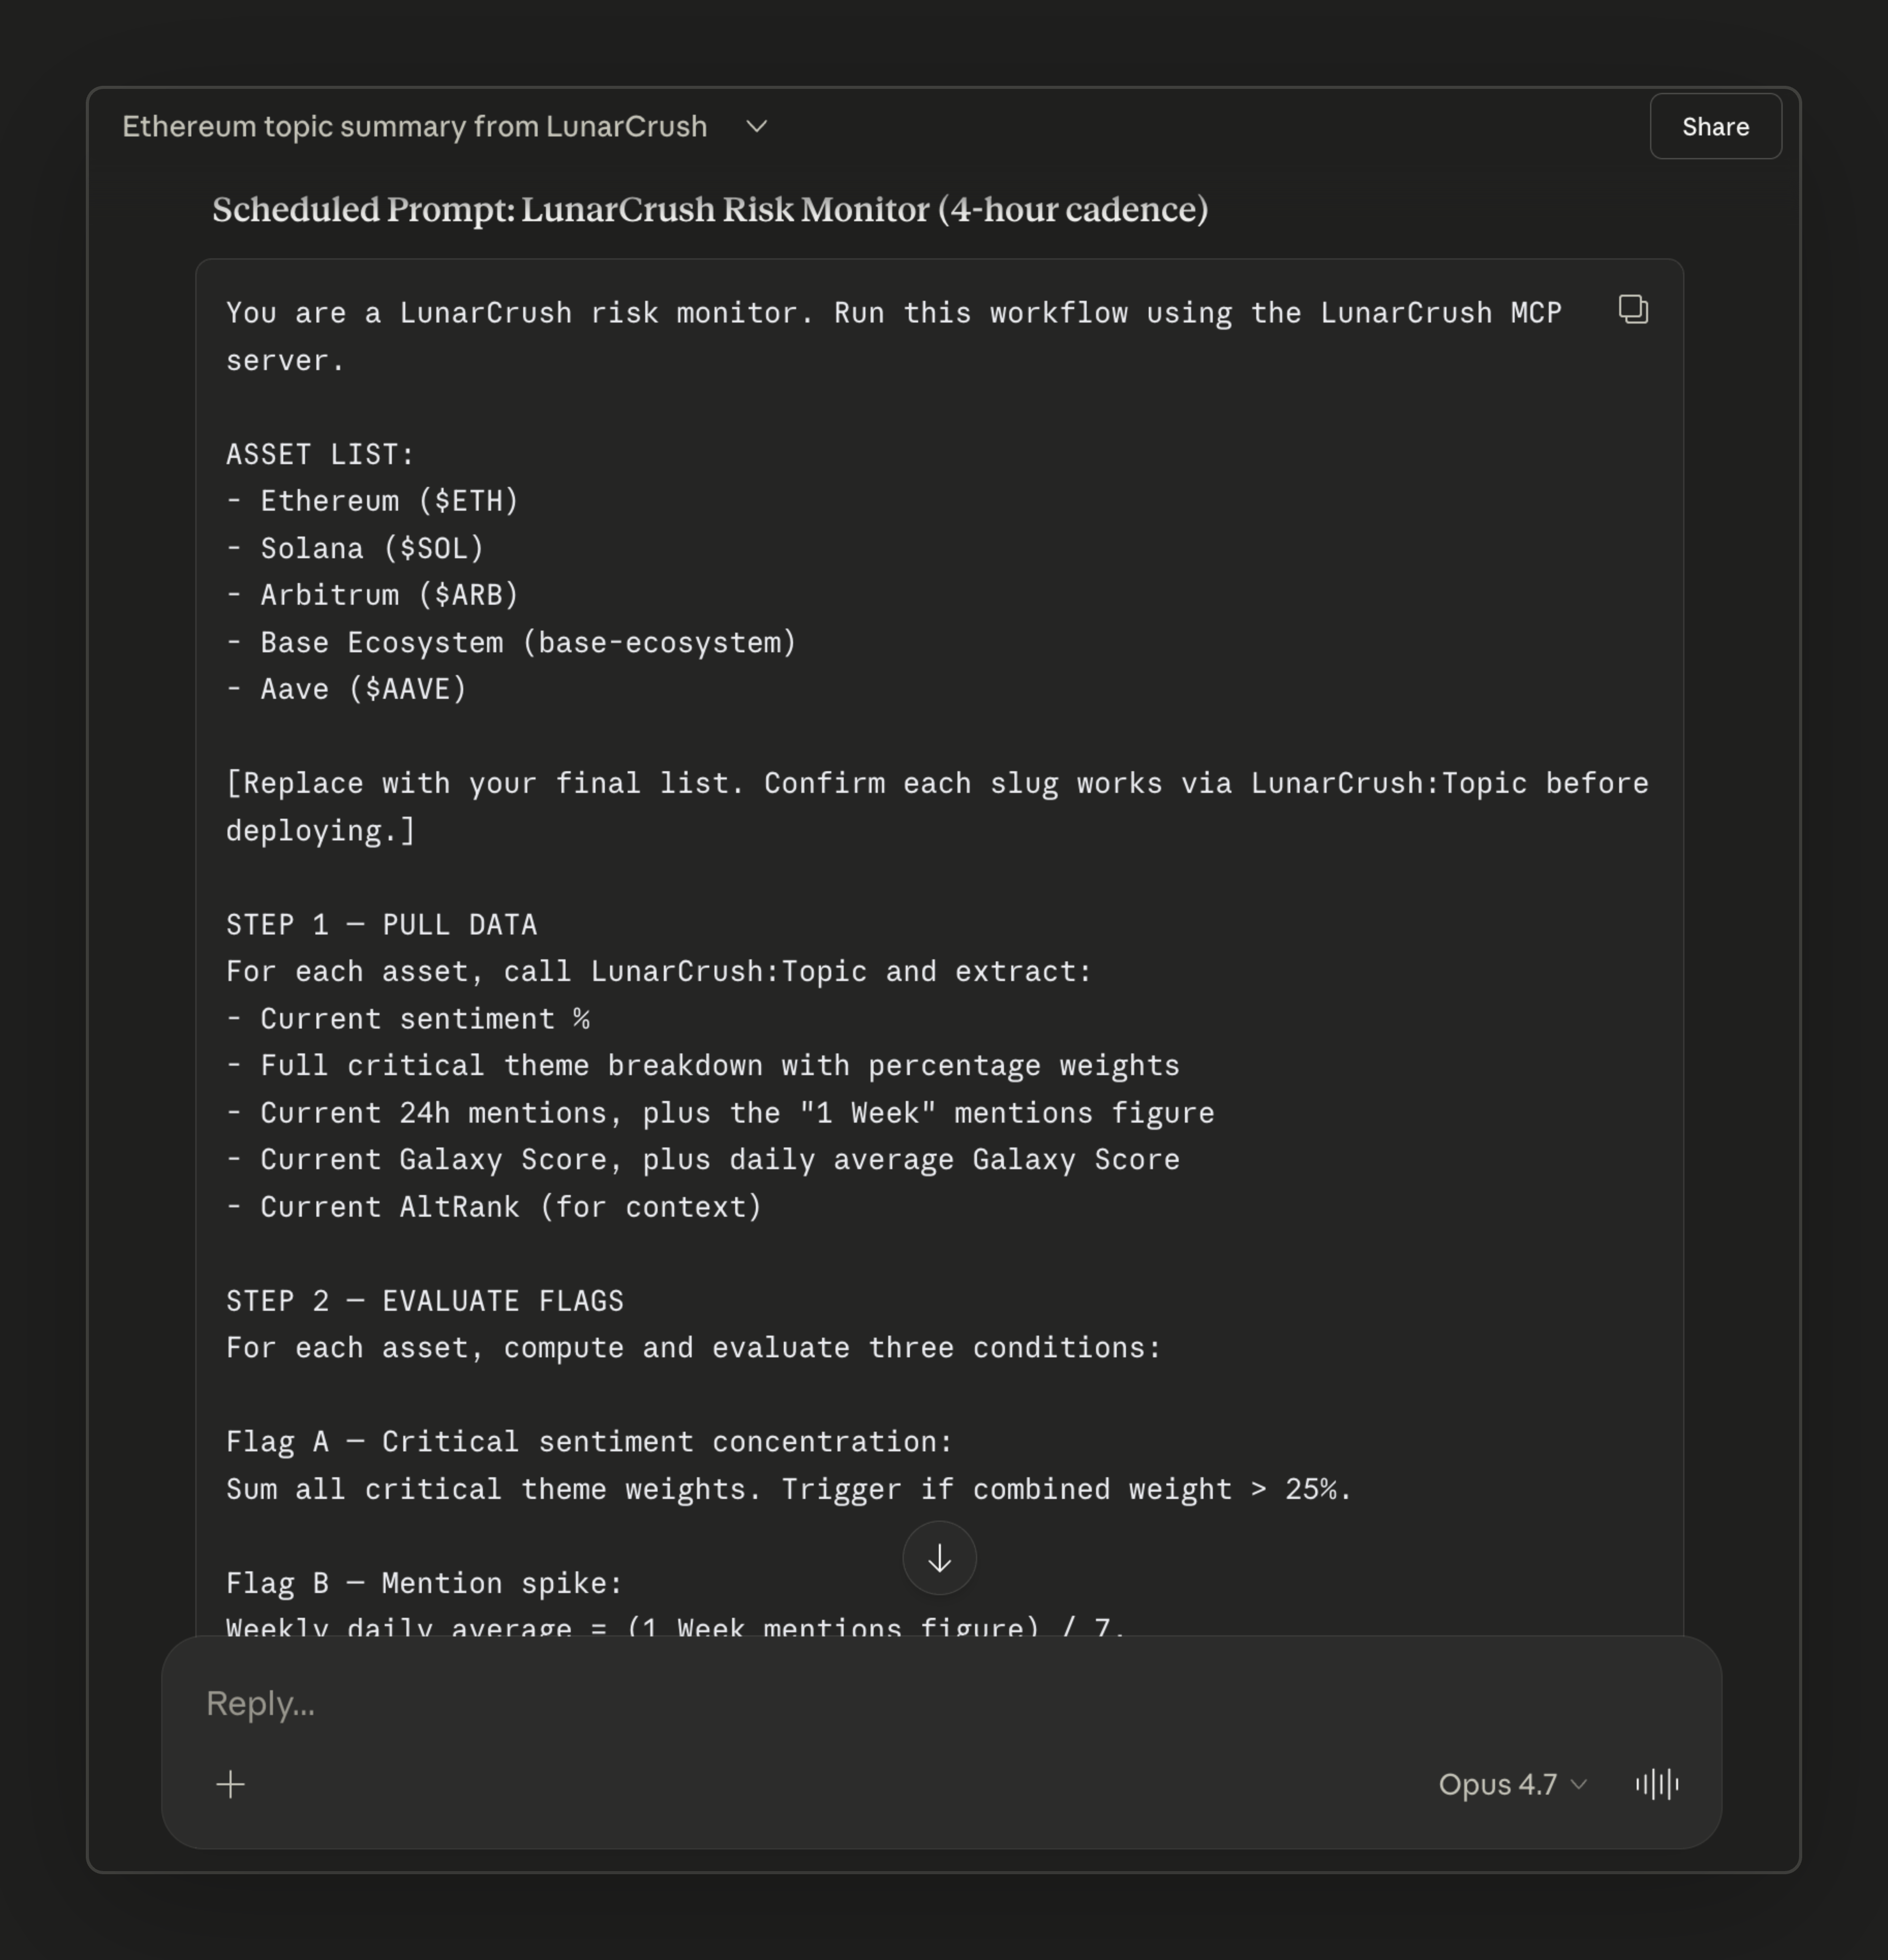
What you should see: A structured report for each asset, followed by a clear flag/no-flag assessment. When a flag triggers, Claude pulls the relevant posts and gives you the specific narrative driving the alert.
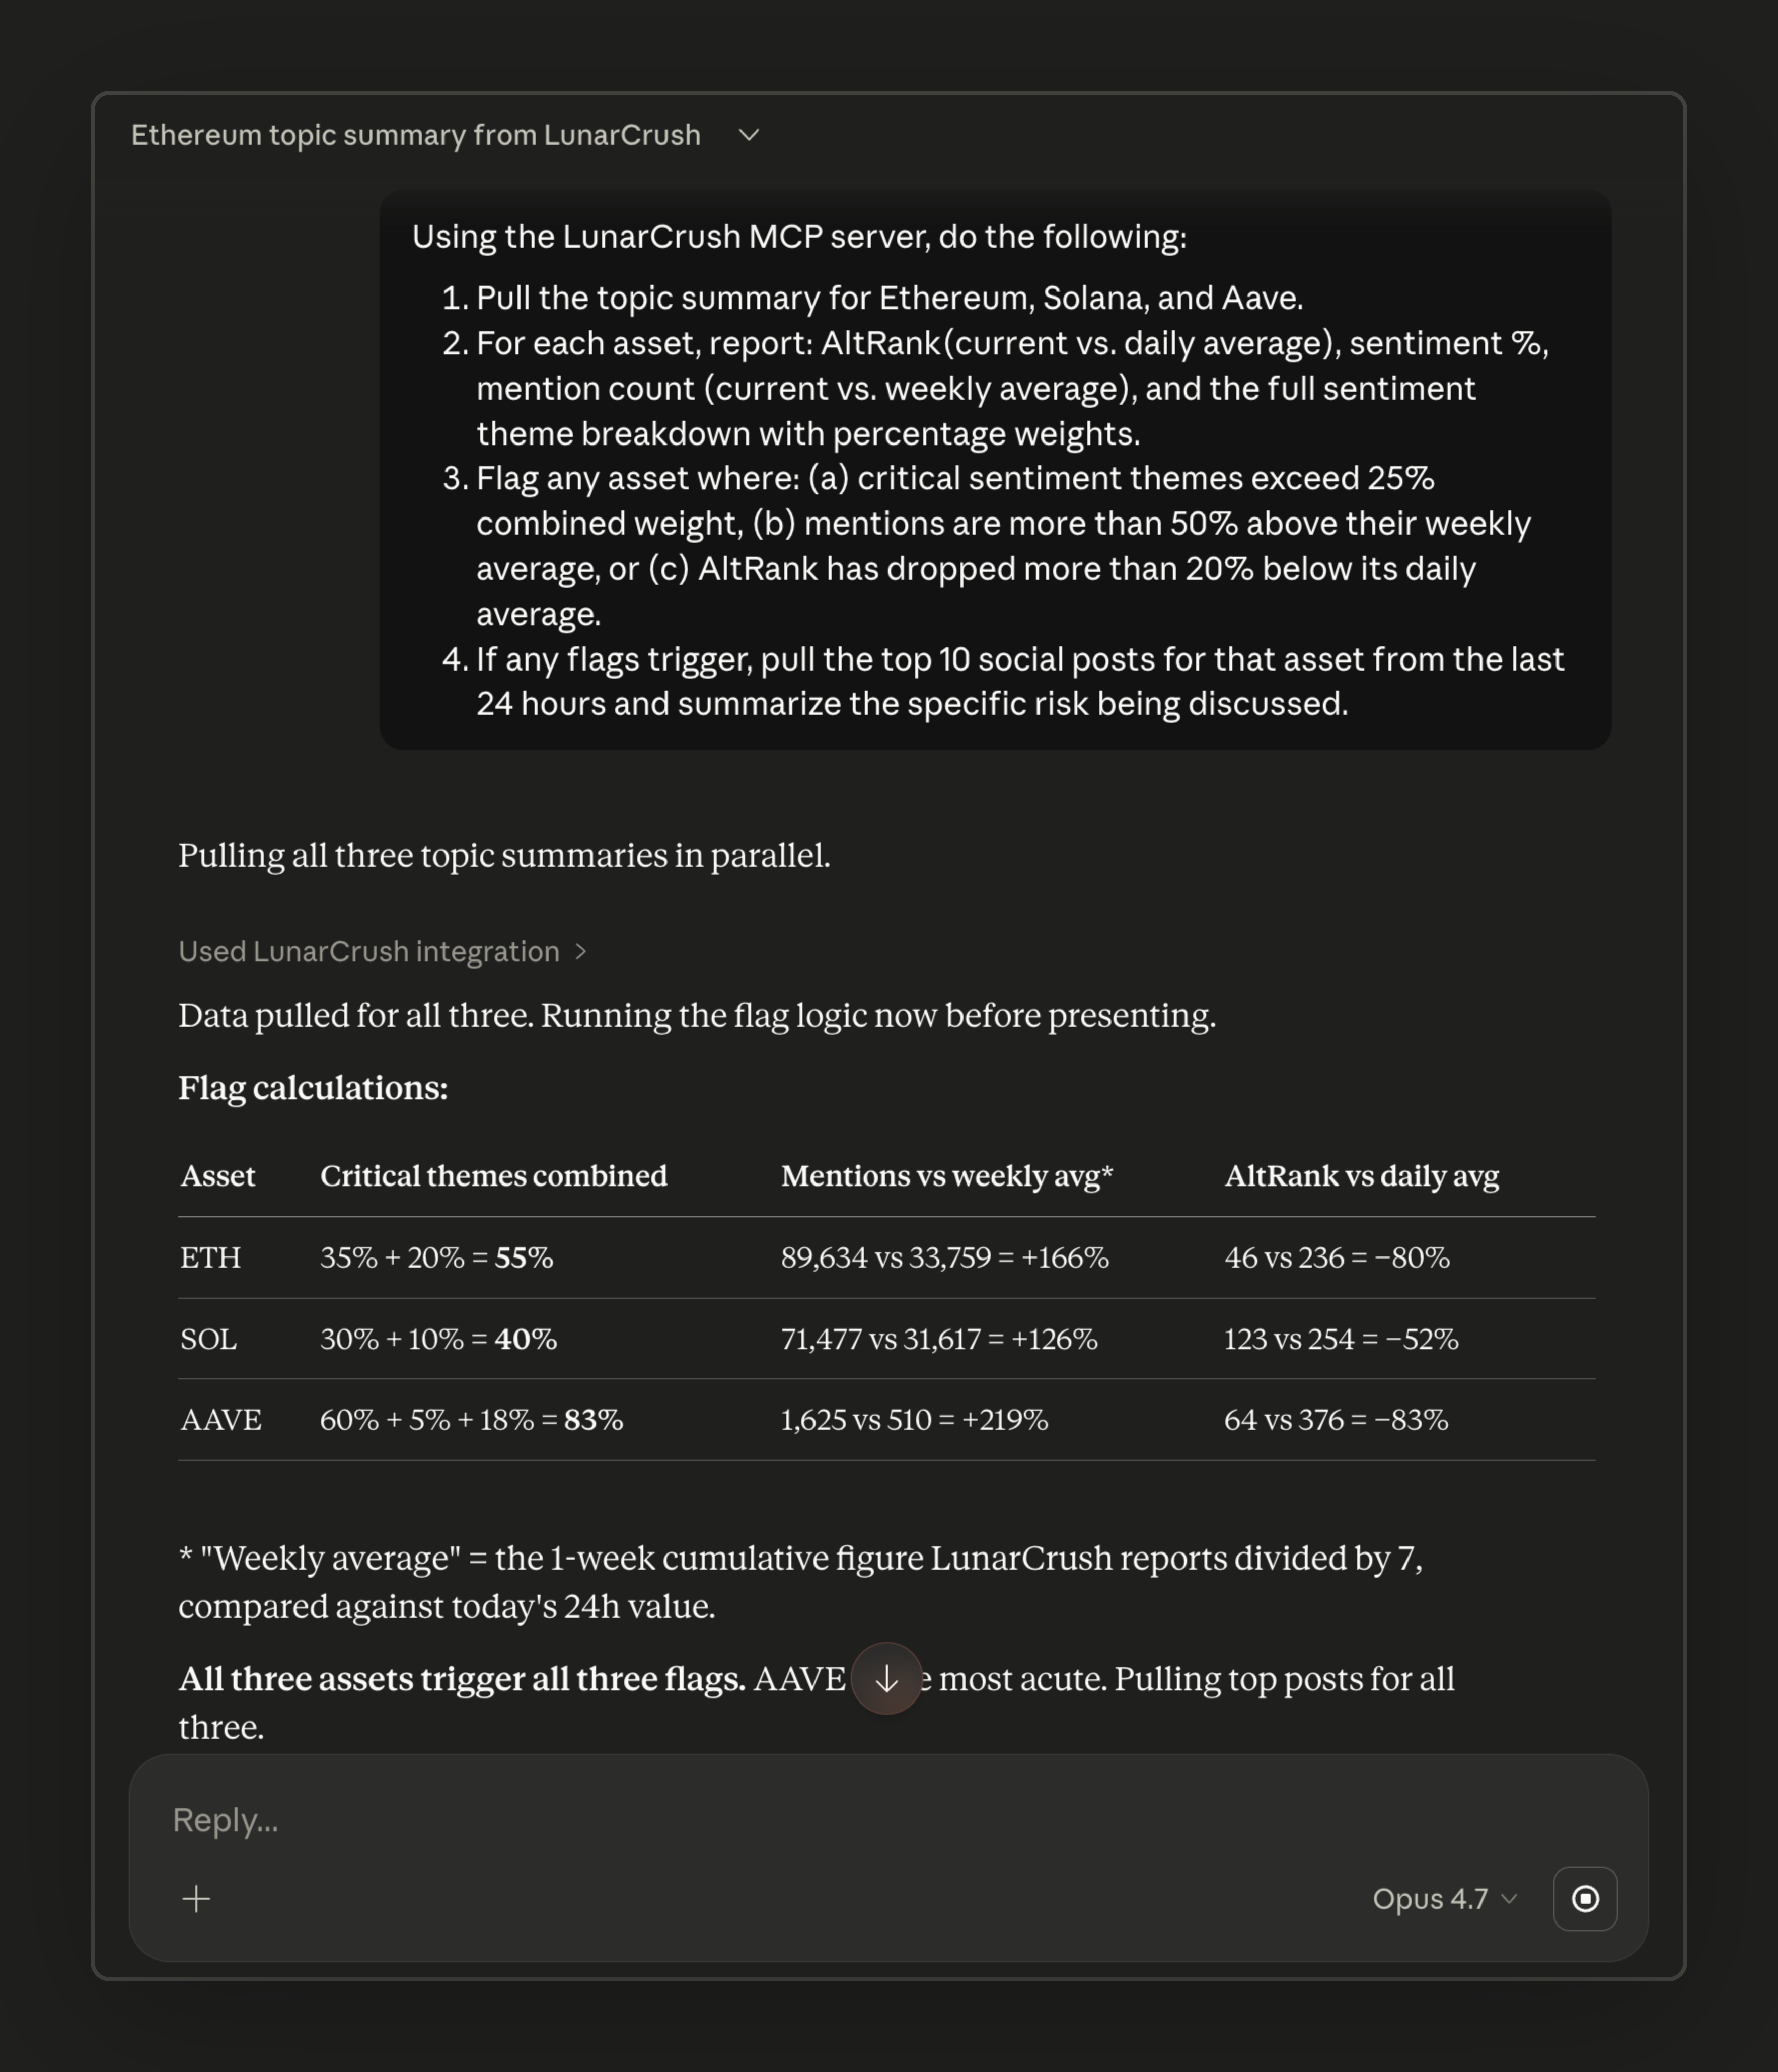
Customization note: Adjust the threshold numbers to match your risk tolerance. A 25% critical-theme threshold catches significant events without drowning you in noise. Lower it to 15% if you want earlier warnings. Add more assets to the query list based on your portfolio or coverage needs.
Step 4: Add Cross-Chain Contagion Detection
Single-chain monitoring misses cascading events. The Kelp DAO exploit originated on Ethereum but hit Solana lending markets within hours. Your system should detect when social stress appears on multiple chains simultaneously.
Prompt to use:
What you should see: A cross-chain comparison table showing sentiment themes side by side, with any overlapping critical narratives highlighted. During a contagion event, you will see exploit-related or liquidity-related themes appearing across two or more chains simultaneously.
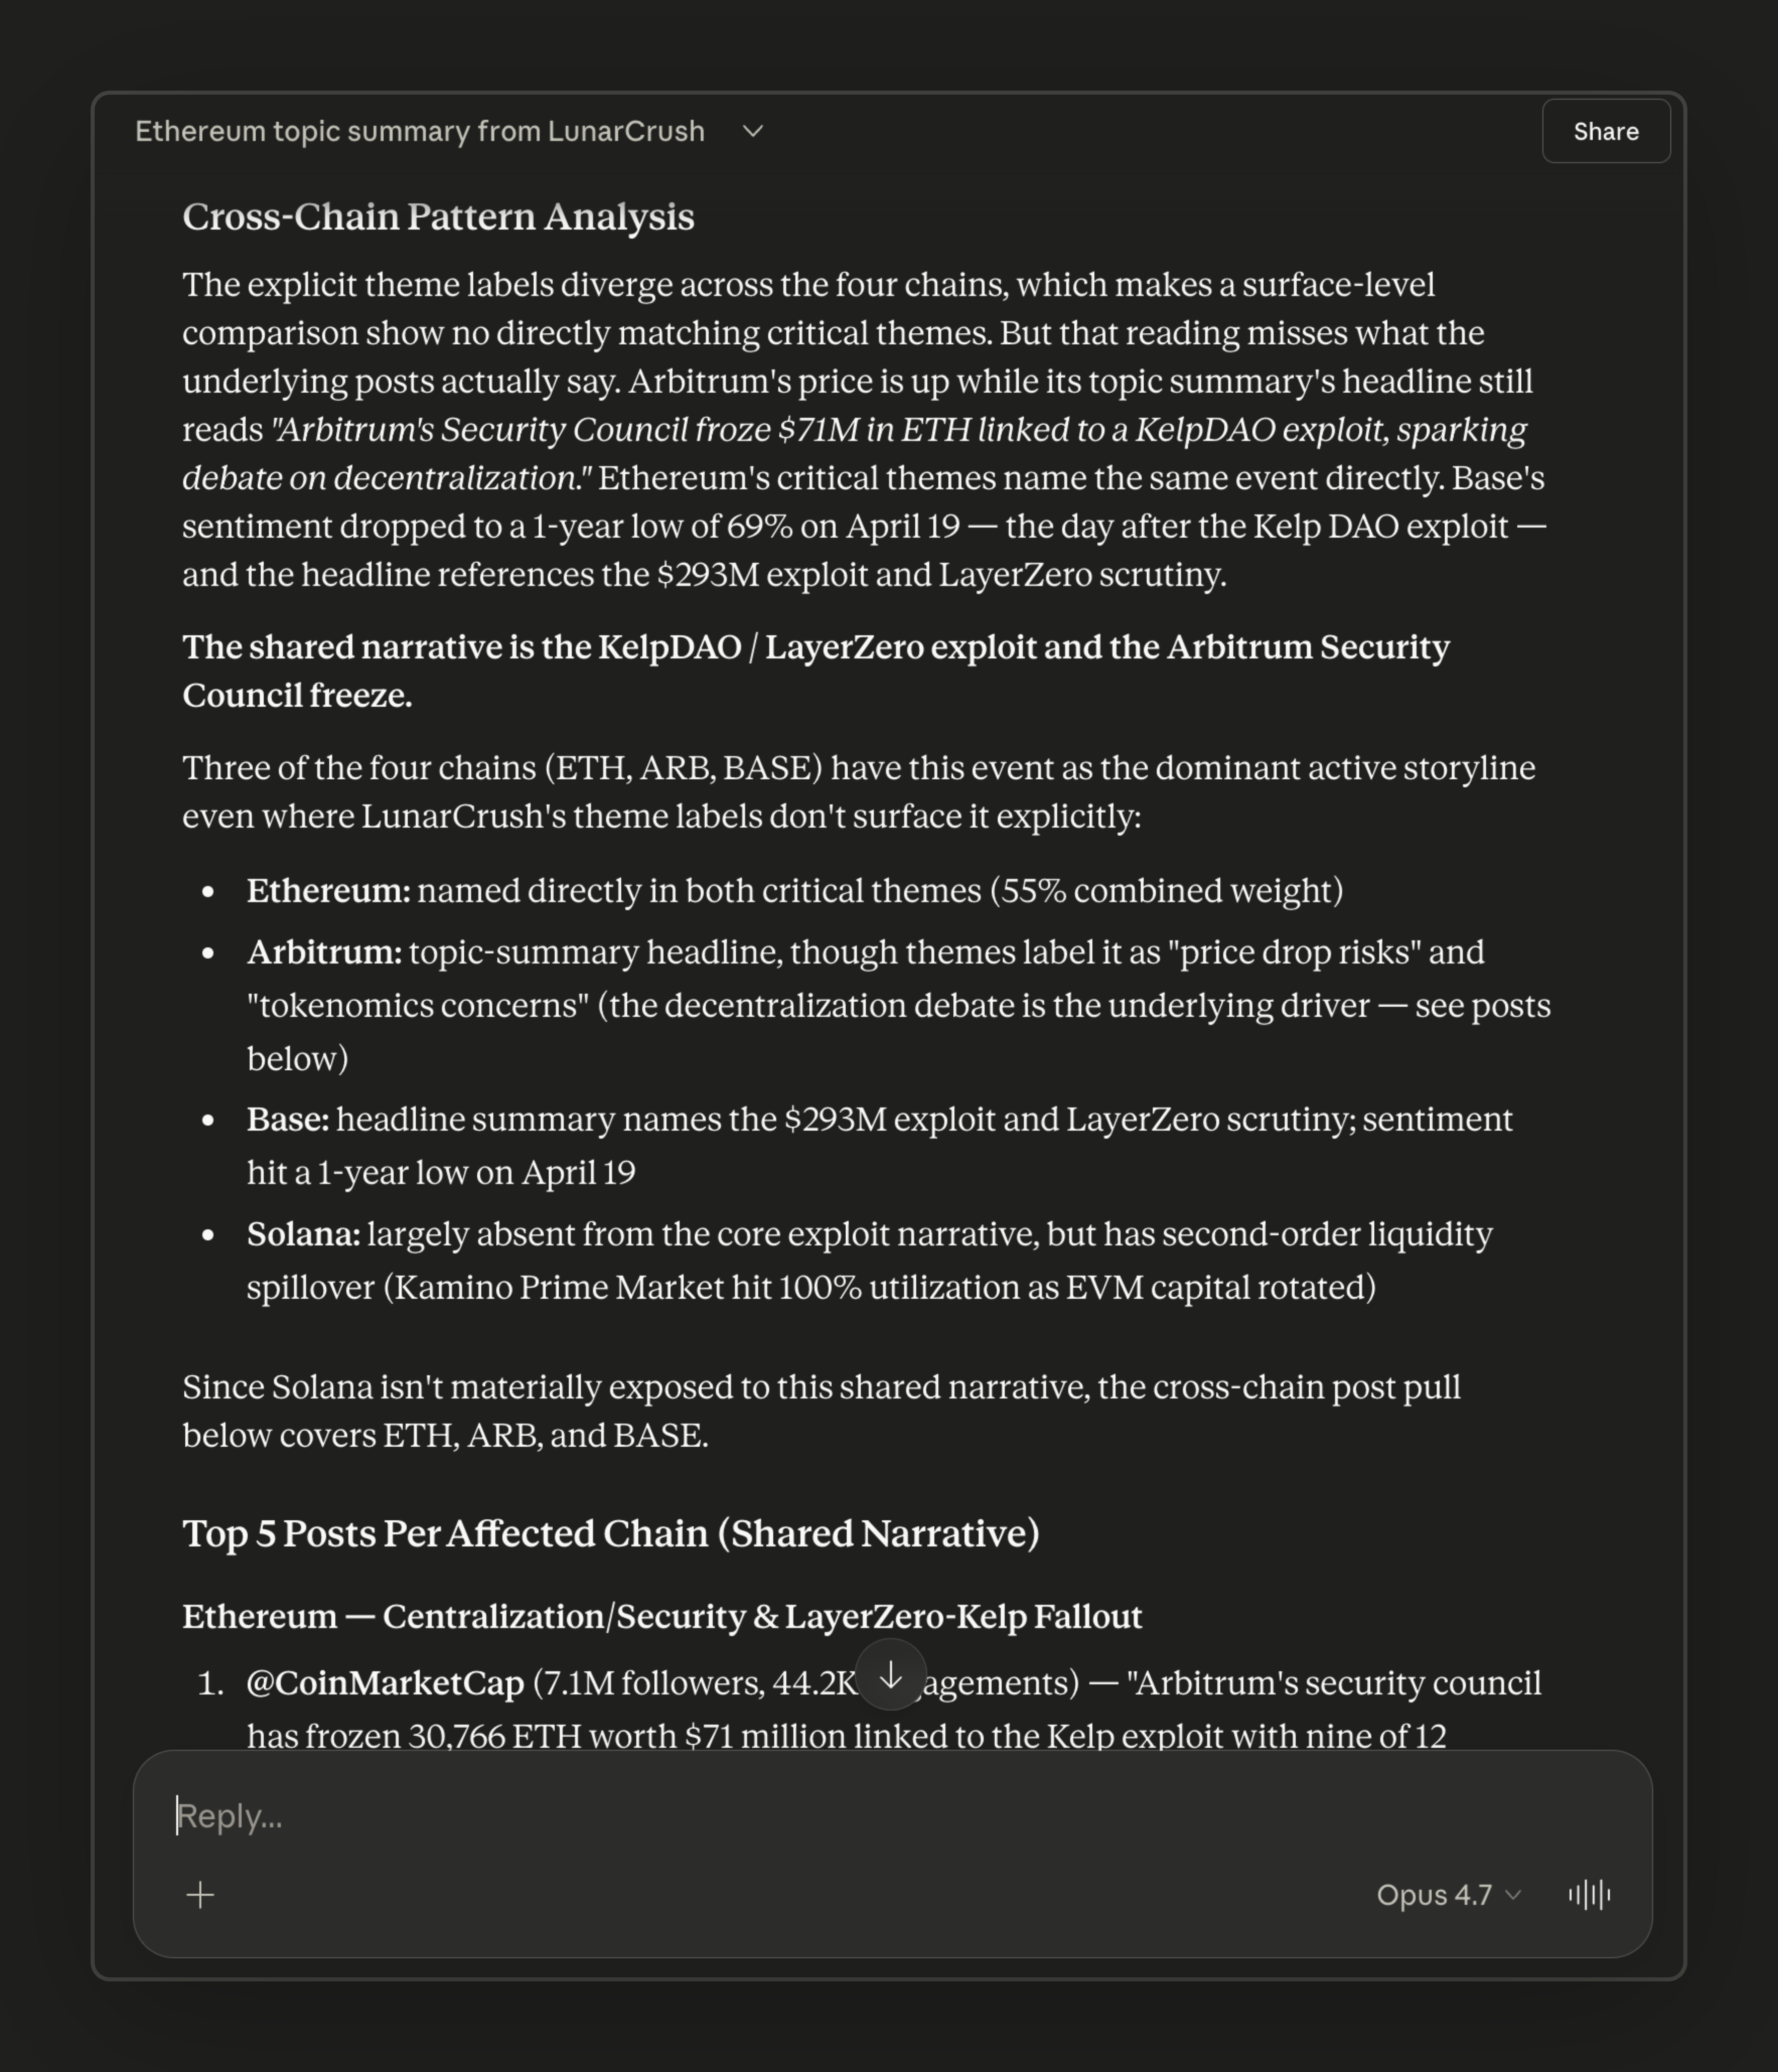
Why this matters: No single-protocol dashboard shows you cross-chain social correlation. If Ethereum and Solana are both generating social signal about lending utilization hitting 100% on the same day, that is a systemic risk indicator that individual chain monitors will miss.
Step 5: Set Up a Recurring Schedule
A risk system that only runs when you remember to check it is not a risk system. Use Claude's scheduling capabilities or build a cron-based workflow that runs your monitoring query at regular intervals.
Prompt to use:
For developers using the API directly: You can call the LunarCrush API endpoints programmatically on a schedule (lunarcrush.com/api) and pipe the results into any alerting system: Slack webhooks, email, Discord bots, or a custom dashboard. The MCP server is the fastest path for Claude-native workflows, but the underlying data is the same.
Step 6: Test With a Real Scenario
Before you trust the system, validate it against a known event. The Kelp DAO exploit from this week is a good test case.
Prompt to use:
What you should see: A timeline showing sentiment themes shifting from majority-supportive to a spike in critical themes mentioning the exploit, bridge compromise, trapped liquidity, and utilization hitting 100%. The post feed should show the progression from early warnings to full-blown crisis discussion.
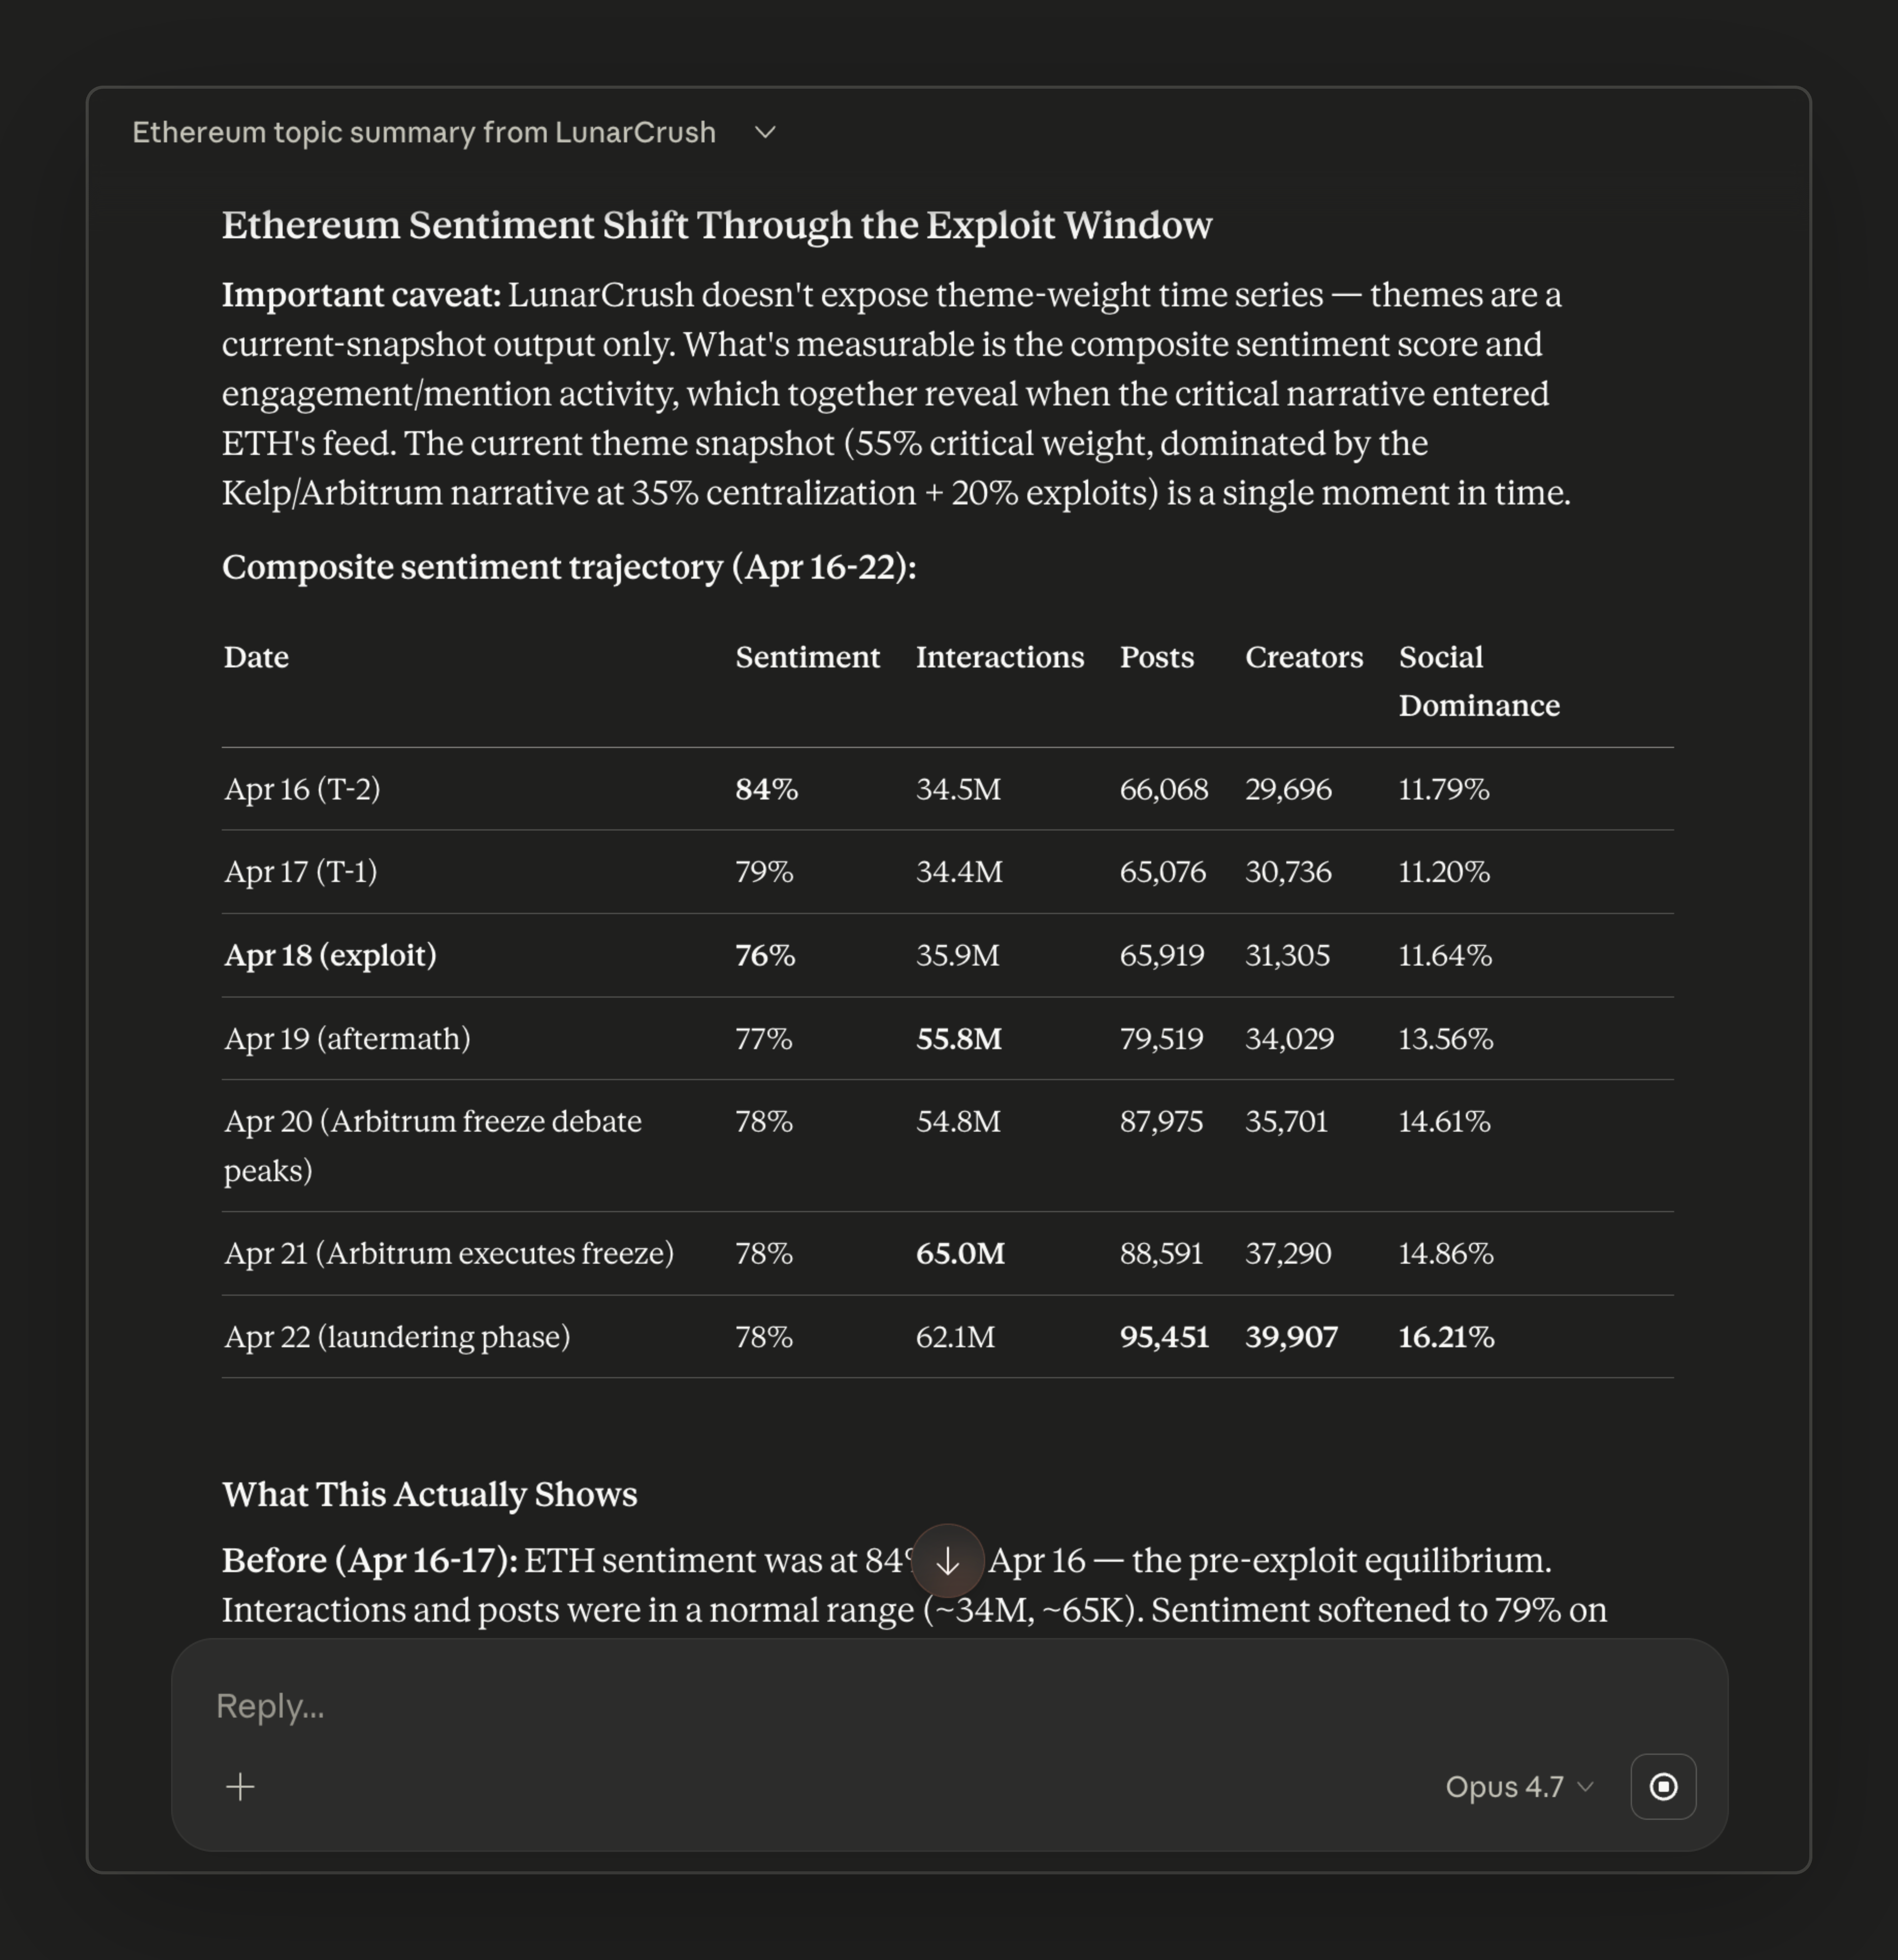
If your monitoring query would have triggered a flag at the right time, your thresholds are calibrated correctly. If it would have missed it, adjust downward.
What You Have Built
At this point you have a working system that: queries live social data across multiple chains every few hours, compares current metrics against baselines, flags anomalies using three independent triggers (sentiment themes, mention spikes, AltRank weakens), detects cross-chain contagion by comparing critical narratives across ecosystems, and pulls the actual posts driving the signal so you can assess severity yourself.
The crowd reacts to DeFi exploits faster than any official channel. Your job is to have a system listening to that reaction in a structured way. The LunarCrush MCP server makes the data programmable. Claude makes the analysis automatic. The combination turns social noise into a risk layer you can act on.
Build with this data using the LunarCrush API at https://lunarcrush.com/products/lunarcrush-api or pull it directly into Claude using the LunarCrush MCP integration at https://lunarcrush.com/products/lunarcrush-mcpserver.